filmov
tv
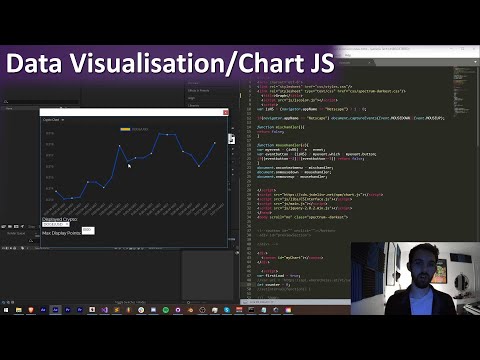
Adobe Extension Tutorial: Data Visualisation/Chart JS

Показать описание
Learn how to visualise data easily in your extension with Chart JS!
---------------------
Timestamps:
Introduction- 0:00
Setting up Chart JS- 2:09
Changing Chart Data and Animation- 6:45
Outro- 17:57
Donate:
BTC- 3H5VB5RTUs6cNYuuauWd1pzcrUDiE66qsq
ETH- 0x63c70f3d0aB34F2de6afA872f2E1E39B73cBE794
#adobeextension #chartjs #datavisualisation
Become a channel member to help support and get access to perks:
 0:18:56
Adobe Extension Tutorial: Data Visualisation/Chart JS
 0:03:24
Top 6 Tools to Turn Code into Beautiful Diagrams
 0:07:18
Adobe Extension Tutorial: Extension In Any Program
 0:04:49
Create your first chart
 0:03:46
Get started with Datylon for Illustrator | Chart & graph maker plugin for Adobe Illustrator [202...
 0:24:50
How to use Adobe Illustrator to clean up data visualizations
 0:04:33
20. Adobe Analytics Tutorial - Tag Custom Button/Core Extension Mouse Click #AdobeAnalytics #Adobe
 0:14:10
IDTK beta 0.1.8 full version plus data visualization tool
 0:02:58
Dynamically Configuring the Adobe Analytics Report Suite
 0:09:22
DataHero Full Demo
 0:04:44
Display Calendar Events in Adobe Analytics Analysis Workspace Line Visualization
 0:03:54
ArcGIS Maps for Adobe® Creative Cloud® - Using Processes & Custom Libraries
 0:02:33
Color Eyedropper Extension for Defining Custom Palettes
 0:01:04
How to import Adobe Analytics data in Tableau (using the free Daexus Catalyst Connector)
 0:04:28
Adobe Analytics Forecasting. Analysis Workspace 2019
 0:08:17
How to Customize the Smart Charts CSV Infographics After Effects Template
 0:00:24
Kitchen Design👩🍳- SketchUp #shorts #sketchup #kitchendesign #sketchuptutorial
 0:05:18
ArcGIS Maps for Adobe® Creative Cloud® - Adding data
 0:00:15
5 Ways Visualize Point Density Using The New York City Motor Vehicle Crashes In 2020 - ESRI #Shorts
 1:09:26
ArcGIS Pro to Adobe Illustrator | Time-Saving Cartography Tools in ArcGIS Maps for Adobe
 0:07:25
Invisible Panel in Adobe Analytics Analysis Workspace
 0:05:10
Target Achievement Visualization in Adobe Analytics Workspace 2019
 1:00:23
ArcGIS Maps for Adobe Creative Cloud: Ask the Experts Livestream
 0:04:05
Understanding How Data Gets into Analysis Workspace
Комментарии