filmov
tv
Graphing Trigonometric Functions sin x, cos x and tan x

Показать описание
#trigonometricfunction #graphing
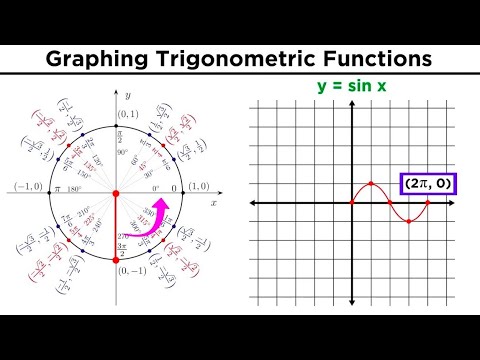
In this video, we look at how the sketch of the trigonometric graphs y = sin x, y = cos x and y = tan x was derived from the definition of the trigonometric functions using the unit circle.
The graph y = sin(theta) is derived from tracking the change in the y-coordinate as the angle theta rotates around the unit circle.
The graph y = cos(theta) is derived from tracking the change in the x-coordinate as the angle theta rotates around the unit circle.
The graph y = tan(theta) is derived from tracking the ratio y-coordinate/x-coordinate as the angle theta rotates around the unit circle.
 0:22:37
 0:11:40
 0:07:24
 1:07:58
 0:30:40
 0:00:27
 0:06:22
 0:10:38
 4:57:57
 0:14:07
 0:08:05
 0:02:28
 0:04:03
 0:03:43
 0:04:59
 0:12:00
 0:18:39
 0:13:14
 0:00:59
 0:04:55
 0:05:03
 0:05:48
 0:05:14
 0:08:44