filmov
tv
Phase diagrams of binary solutions: dew point and bubble point

Показать описание
In this video, prof. Márcio Neto shows how phase diagrams of binary solutions are constructed, and shows how to use them to obtain the dew point and bubble point of a given system.
 0:06:37
Phase diagrams of binary solutions: dew point and bubble point
 0:07:15
Binary Phase Diagrams Explained
 0:06:37
Igneous Petrology Series: Lesson 5 - Binary solid solution phase diagrams
 0:03:08
y-x Phase Diagram for VLE of a Binary Mixture
 0:23:25
How to use phase diagrams and the lever rule to understand metal alloys
 0:13:28
Physical Chemistry: Binary Phase Mixture and Phase Diagrams for Ideal Systems
 0:29:19
noc18-mm20 Lecture 13-Phase Diagram formation:Binary Solution
 0:03:51
Distillation and phase equilibria
 0:20:23
Lecture 19 Binary Phase Diagrams Part 1
 0:16:55
Phase Diagram 3: Binary solid solution
 0:05:00
Phase Diagrams and Lever Rule example problem
 0:17:57
2.1 | MSE104 - Binary Phase Diagrams
 0:20:52
PHASE DIAGRAM (PART 4) : BINARY EUTECTIC PHASE DIAGRAM (LIMITED SOLID SOLUTION)
 0:09:15
PCE58 Binary phase diagram of an ideal solution
 0:08:08
T-X-Y DIAGRAM OF BINARY VLE MIXTURES
 0:06:39
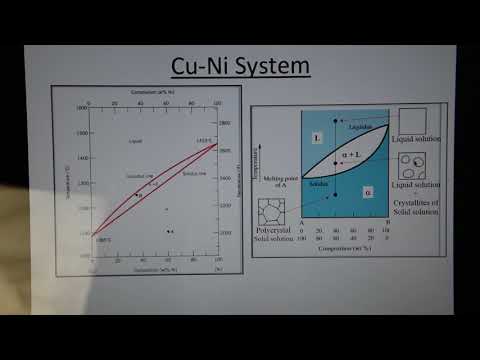
Binary Phase Diagrams - Cu-Ni System
 0:13:08
Pressure-Composition Phase Diagram
 0:10:07
Binary Phase Diagram (Txy and xy)
 0:14:53
Txy and Pxy Diagrams
 0:13:09
MEC281 : EXERCISE BINARY EUTECTIC PHASE DIAGRAM (NO SOLID SOLUTION)
 0:05:16
Binary phase diagrams
 0:08:12
Phase Diagrams 1 - Binary Eutectics
 0:26:14
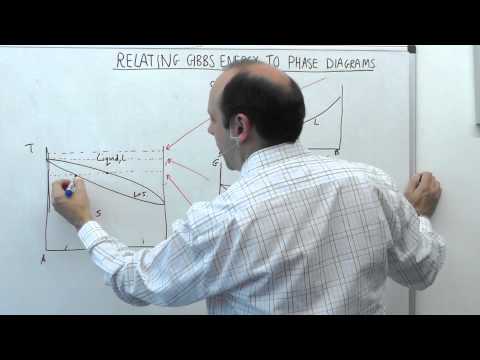
5.2 | MSE104 - Gibbs Energy Curves
 0:09:27
Plagioclase Binary Phase Diagram
Комментарии