filmov
tv
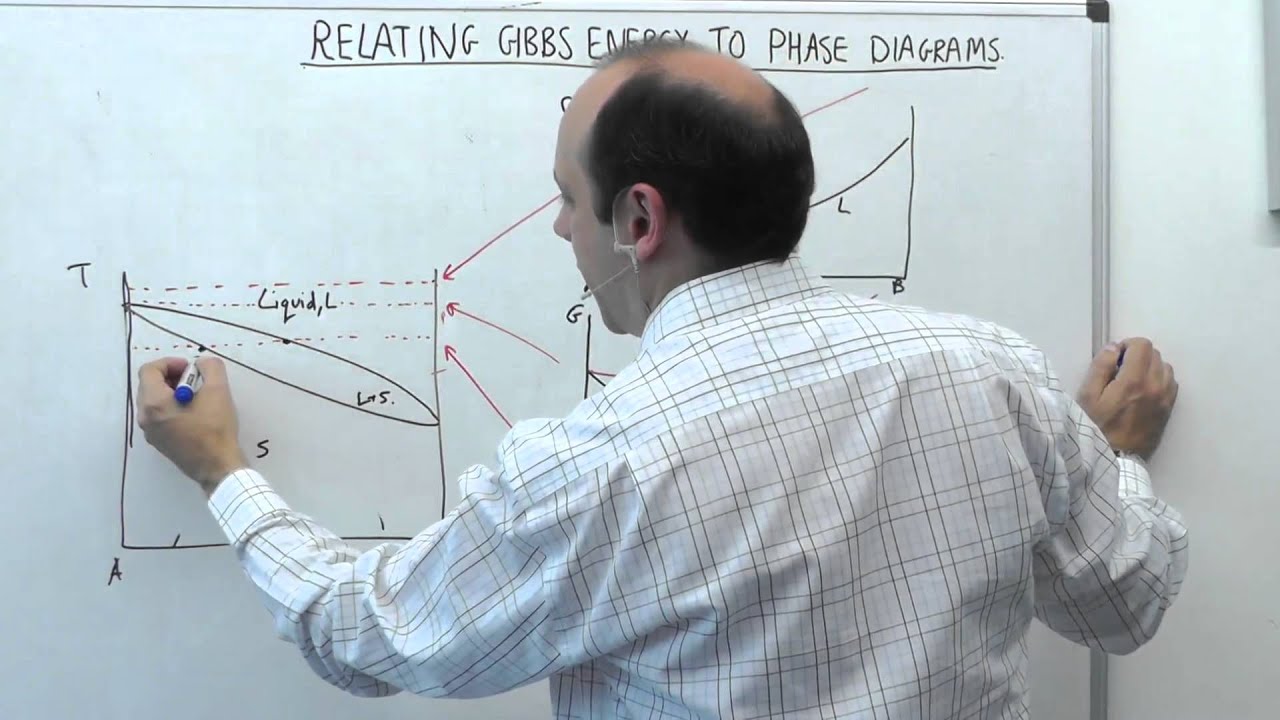
5.2 | MSE104 - Gibbs Energy Curves
Показать описание
Segment 2 of lecture 5. Relating Gibbs Energy Curves to Phase Diagrams - i.e. the common tangent construction.
Lecturer: Dr David Dye.
Licence: Creative Commons
Department of Materials, Imperial College, London, UK
Lecturer: Dr David Dye.
Licence: Creative Commons
Department of Materials, Imperial College, London, UK
 0:26:14
5.2 | MSE104 - Gibbs Energy Curves
 0:48:08
5.1 | MSE104 - Thermodynamics of Solutions
 0:15:08
Phase Diagrams | Gibbs Phase Rule (w/ 5 Examples)
 0:05:14
Surface Thermodynamics
 0:04:41
Gibbs Phase Rule
 0:15:11
Thermodynamics Part 5 Calculating Gibbs Free Energy
 0:05:16
Lecture 5: Phase Diagrams Lowest Energy Phase Wins!!
 0:26:14
Gibbs Energy Curves
 0:05:33
Lecture 5: Drawing Free Energy Curves at Isotherms in a Binary Phase Diagram
 0:50:17
Gibbs Free Energy
 0:19:42
Physical Chemistry for the Life Sciences (2nd Ed) - Chapter 5 - Gibbs & Nernst Equations
 0:19:27
1.1 | MSE104 - Introduction to Phases
 0:17:57
2.1 | MSE104 - Binary Phase Diagrams
 0:28:47
9.1 | MSE104 Non-equilibrium cooling of steels
 0:04:15
Gibbs Free Energy Change for Non-Ideal Solution
 0:07:17
Phase Rule - Two component system
 0:12:12
2.3 | MSE104 - Calculating phase fractions (lever rule)
 0:06:23
Gibbs Free energy (dG = VdP - SdT); how it's derived and why we need it
 0:07:25
1.8: Binary phase diagrams of systems with limited solubility
 0:10:47
PCE71 Excess Gibbs Models and 1-parameter Margules Equation
 0:45:48
Gibbs Free Energy
 1:25:08
ph12c lecture13 Gibbs free energy
 0:09:54
1.5: Binary phase diagrams of systems with full solubility
 0:11:07
The thermodynamics of mixing
Комментарии