filmov
tv
Tableau data visualization: Create your first Tableau visualization!

Показать описание
In this lesson, we’ll create our first visualization and it is going to be awesome.
As you can see the workspace area is empty right now. We’ve already loaded the GDP data file and we can see that here.
The way data is organized here is rather interesting. Our attention should be focused on the ‘dimensions and measures’ part of the screen.
First off, we should notice that Tableau has been very smart and managed to organize our data – categorical variables are right here under “dimensions”, while numerical data such as the countries’ actual GDP is under “measures”. “Dimensions” have been colored in blue, and “measures” are in green.
Another important remark we have to make is that some of the fields we see here are in italics and others aren’t. The distinction between the two is that Tableau generates certain fields based on the data it finds. When Tableau generates its own fields such as the “Measure names” field we see here, these are fields that are not contained in our original data source, but Tableau deems that these can be useful and creates them for us. The same thing is true for “Latitude”, “Longitude”, “Number of records”, and “Measure values” we see in green under “Measures”. The rest of the fields written without Italics are the ones we saw in the Excel file we loaded – “Country name”, “Indicator name”, and the years from 2002 to 2016, where we have countries’ GDP figures.
365 Data Science is an online educational career website that offers the incredible opportunity to find your way into the data science world no matter your previous knowledge and experience. We have prepared numerous courses that suit the needs of aspiring BI analysts, Data analysts and Data scientists.
We at 365 Data Science are committed educators who believe that curiosity should not be hindered by inability to access good learning resources. This is why we focus all our efforts on creating high-quality educational content which anyone can access online.
#Tableau #Spreadsheets #DataScience
 0:07:13
Tableau data visualization: Create your first Tableau visualization!
 0:14:05
How to Create Visualizations in Tableau | Tableau Tutorials for Beginners
 0:17:04
How to Install Tableau and Create First Visualization | Tableau Tutorials for Beginners
 0:28:42
Tableau for Data Science and Data Visualization - Crash Course Tutorial
 0:16:11
Learn Tableau in 15 minutes and create your first report (FREE Sample Files)
 0:11:31
Make an AWESOME Tableau Dashboard in Only 10 Minutes
 0:12:54
Tableau Tutorial for Beginners | Create Your First Dashboard
 1:57:19
Tableau Data Visualization Beginner Tutorial
 0:59:46
12 Data Visualization Tips & Tricks: Going Deeper
 0:26:43
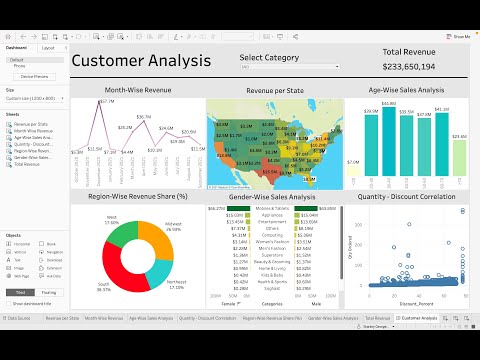
Customer Analysis using Tableau - Dashboard From Scratch
 0:23:38
Creating Data Visualizations with Tableau | Google Data Analytics Certificate
 0:23:03
Tableau Basics for Beginners - Tableau in Two Minutes
 0:32:18
A TABLEAU PORTFOLIO PROJECT to showcase ADVANCED visualization skills
 0:01:34
How to Create a Story and Add Story Points in Tableau
 0:36:44
Tableau Dashboard from Start to End (Part 1)| HR Dashboard | Beginner to Pro | Tableau Project
 0:29:58
Create Netflix dashboard with Tableau in 30 minutes
 0:20:43
TABLEAU HOW TO CREATE DASHBOARD
 0:00:52
How I Use TABLEAU as a DATA ANALYST
 0:05:29
A step by step tutorial to create an interactive Dashboard in Tableau
 2:24:15
Tableau Complete Project End-to-End | Like I Do in My Real Projects
 0:20:25
Your Guide to Designing Infographics in Tableau | Tableau Conference 2023
 0:00:33
How to create a pie chart using multiple measures in Tableau
 2:42:52
Tableau Full Course - in 3 Hours | Become a Data Visualization Rockstar | Beginner Level
 0:21:50
Building a Tableau Portfolio Dashboard to Land Your Dream 6-Figure Job
Комментарии