filmov
tv
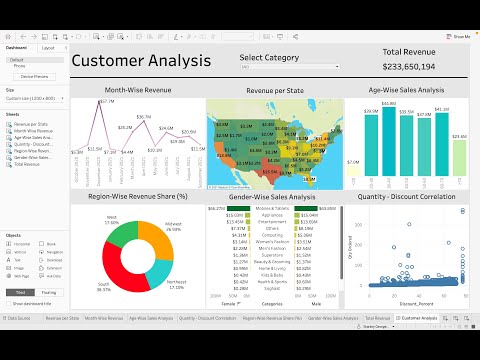
Building a Tableau Portfolio Dashboard to Land Your Dream 6-Figure Job

Показать описание
If you're looking to land a six-figure job in the data analysis field, having a strong portfolio of your work is key. One of the best ways to showcase your skills and impress potential employers is by creating a Tableau portfolio dashboard.
In this step-by-step guide, I'll show you exactly how to transform a standard Tableau portfolio into one that will stand out from the competition.
Throughout the video, we'll share our expert tips and best practices for creating a visually stunning and informative dashboard.
By the end of the video, you'll have a complete understanding of how to create a Tableau portfolio dashboard that will impress potential employers and help you land your dream six-figure job. Whether you're new to Tableau or have some experience with the software, this video is packed with valuable information that you won't want to miss. So sit back, grab a cup of coffee, and let's dive into building your Tableau portfolio dashboard!
************************************************************************************
JELLYMAN WEBSITE IS LIVE!!!!!!!!!!!!!!!!!!!!!!!!!!!!!!!!!!!
For Comprehensive Tableau Training for Beginners to Advanced, visit JELLYMAN EDUCATION at
There are 6 courses available which cover everything you need to know about Tableau Desktop from Beginners to Advanced users and also includes Tableau Online/Server and Tableau Prep.
Hundreds of videos and near 50 hours of content await enthusiastic students ready to take on the next challenge in their Analytics Career.
1) Getting Started with Tableau:
2) Tableau for Beginners:
3) Tableau for Intermediates:
4) Tableau for Experts:
5) Tableau Online:
6) Tableau Prep:
Lastly, the subscription model of the site means you get access to all current and future content. No need to buy individual courses or packages like other sites.
 0:21:50
Building a Tableau Portfolio Dashboard to Land Your Dream 6-Figure Job
 0:34:32
The TABLEAU PORTFOLIO PROJECT to make you STAND OUT from the crowd
 0:32:18
A TABLEAU PORTFOLIO PROJECT to showcase ADVANCED visualization skills
 0:11:31
Make an AWESOME Tableau Dashboard in Only 10 Minutes
 2:24:15
Tableau Complete Project End-to-End | Like I Do in My Real Projects
 4:07:13
Tableau + SQL Project | Data Analyst Portfolio Project | Beginner to Advanced | Start to End Build
 0:01:47
How to build a Tableau Portfolio that will get you hired
 0:29:58
Create Netflix dashboard with Tableau in 30 minutes
 2:42:29
DAY 13 || FREE DATA ANALYSIS TRAINING USING EXCEL, SQL, POWER BI, TABLEAU 24-08-2024
 0:17:04
How to Install Tableau and Create First Visualization | Tableau Tutorials for Beginners
 0:00:06
How to build a Tableau Portfolio
 0:51:59
Build an Emergency Room Dashboard in Tableau | Healthcare Data Analyst Portfolio Project
 1:48:56
Tableau Full Project for Data Analysis | Start to End Tableau Dashboard Project
 0:36:44
Tableau Dashboard from Start to End (Part 1)| HR Dashboard | Beginner to Pro | Tableau Project
 0:26:16
Create an Amazing Dashboard Using Tableau in 26 minutes| Amazon Prime Video
 0:07:39
How to build a Tableau portfolio?
 0:01:40
How to create a portfolio for SQL and Tableau projects so you can get a data analytics job!
 0:26:43
Customer Analysis using Tableau - Dashboard From Scratch
 0:38:47
BEST END TO END DATA ANALYTICS PORTFOLIO PROJECT | TABLEAU & PYTHON
 0:16:11
Full Beginner Tableau Tutorial - Dashboard Project For Your Analytics Portfolio
 0:52:17
Data Analyst Portfolio Project | Tableau Visualization | Project 2/4
 0:25:29
Create Data Science Jobs salaries dashboard with Tableau in 25 minutes
 1:35:31
Build a Hospital Dashboard w/Tableau | Portfolio Ready Data Visualization Project
 0:14:39
10 PORTFOLIO PROJECTS TO ADD TO YOUR DATA PORTFOLIO
Комментарии