filmov
tv
WOW with KPI Card Visuals using Reference Labels and Conditional Formatting | Power BI

Показать описание
KPIs are key to monitoring business performance, but in most cases, they do not tell the whole story.
This can now be overcome using reference labels and conditional formatting in the new card visual in Power BI and I show you how to maximise them in this video.
#powerbi #dax #PBICoreVisuals
📁 Dataset for Sales Data and file for original dim date table M code
🔖c h a p t e r s 🔖
00:00 - Intro
00:38 - Overview
02:45 - Check your PBI version
03:14 - Load data
03:39 - Set up new card visual
04:01 - Add main measure to card visual
05:04 - Format call out value & label
06:57 - Format card layout & look
08:17 - Create a target measure
10:05 - Create a target difference measure
10:24 - Set up target reference label
14:29 - Create target var label with arrows
18:11 - Create a divider line in ref label
19:26 - Add additional reference labels
22:28 - Add conditional formatting
23:23 - Create the conditional format measure
28:34 - Conditional format reference labels
 0:35:03
WOW with KPI Card Visuals using Reference Labels and Conditional Formatting | Power BI
 0:05:40
How to create Custom KPI Card in PowerBI | MI Tutorials
 0:16:36
A CARD VISUAL you haven’t SEEN before | MULTIPLE KPIs with line breaks ON HOVER in Power BI
 0:08:47
Happy little accidents with the Power BI Card Visual
 0:18:35
Power BI Practice Solution ROUND #10 I CUSTOM KPI CARDS
 0:46:30
KPI Card Workshop
 0:01:00
KPI CARD HOVER EFFECT in Power BI #Shorts
![[PRODUCT LAUNCH] Supercharge](https://i.ytimg.com/vi/1Pk-j3jxMjw/hqdefault.jpg) 0:18:47
0:18:47
[PRODUCT LAUNCH] Supercharge your KPI dashboard in Power BI | New Zebra BI Cards visual 🔥
 0:59:50
Creating your Power BI Reports with “WOW”
 0:25:13
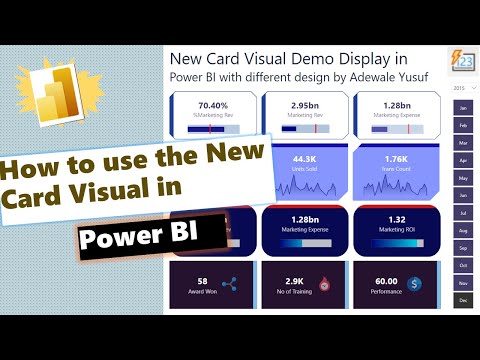
How to use the New Card visual in Power BI
 0:06:28
How to create STUNNING multicards in Power BI with a little bit of DAX
 0:06:21
Want a BEAUTIFUL Power BI Report? Start here!
 0:11:46
HOVER EFFECT that will WOW end users? See how to INSTANTLY upgrade your PAGE NAVIGATION in Power BI!
 0:44:14
Build THIS! Report DESIGN in Power BI | FULL TUTORIAL
 0:11:15
How I Compare YTD, QTD, MTD, WTD & Daily Sales in Tableau
 0:01:34
How to add definition to your KPIs in #PowerBI || Zebra BI Knowledge Base
 0:30:22
#WOW2022 | Week 43 | Power BI | Advanced Formatting
 0:06:24
Add KPI symbols in Power BI based on formula results using DAX
 0:01:02
Introducing KPI by Powerviz — A Powerful Power Bl Custom Visual.
 0:13:15
Copilot for Power BI: Your Ultimate Copilot Guide
 0:10:56
Good KPIs, Bad KPIs and the north star metric | A Power BI Goals 🏆 pre-guide
 0:13:18
What investors ACTUALLY want to see in your PITCH DECK.
 0:18:24
Tarjeta KPI Avanzada en Power BI
 0:15:34
MASTERING Bar Charts in Power BI | No more Cut Labels
Комментарии