filmov
tv
How to add a data table to a chart? | Excel 2007

Показать описание
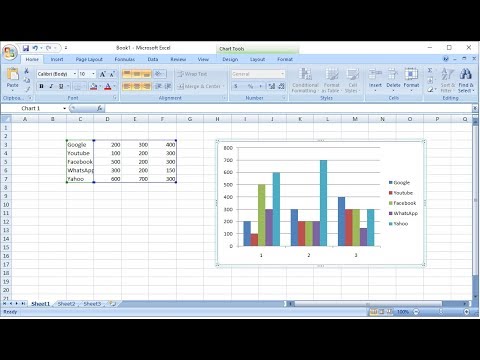
Click on the chart and go under Chart Tools and Layout tab. In Labels section click on "Data Table" and from the appearing menu choose whether you wish for the table to show up in the first place or whether the table should include the legend keys as well. The last option is handy in case you wish to remove the legend from the chart.
 0:01:28
How To Add A Data Series To A Chart In Microsoft Excel
 0:01:43
How to Add the Data Analysis ToolPak in Excel | Installing Analysis Tool for Statistical Analysis
 0:05:00
How To Add Data Packs to Minecraft 1.21
 0:00:33
How To Quickly Add Extra Data To Existing Excel Chart
 0:00:52
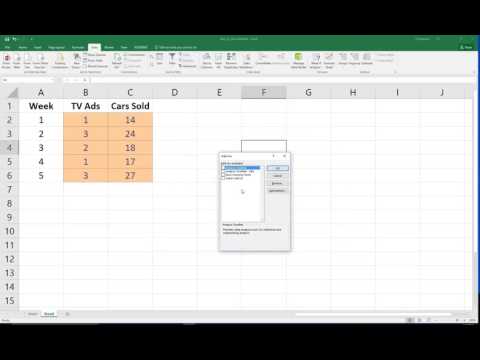
How to add Data Analysis Option | Add In | Excel
 0:00:27
How to add a data table to a chart? | Excel 2007
 0:01:40
How to Add Data to an Existing Excel 2013 Chart
 0:05:06
How to Add Data to an Existing Excel Chart
 0:06:48
Use Data Tansfer Objects (DTOs) in .NET the Right Way 🚀
 0:01:33
How to Add New Extra Data to Existing Excel Chart (Easy)
 0:01:40
How to add data points to an existing graph in Excel
 0:03:49
ArcGIS Pro - Connect to a Folder and Add Data
 0:00:29
424 How to add data label to line chart in Excel 2016
 0:00:20
How to add Dropdown list in Excel? ( In 20 Seconds) | Data Validation trick #shorts #excel
 0:00:40
How to Add a Data Refresh Time Stamp to a View in a Dashboard in Tableau
 0:02:20
How to Add the Data Analysis ToolPak in Excel 2016 for Windows
 0:00:38
How to add a cellular data plan on your iPhone
 0:04:12
How to Add and Edit A Data Table To A Chart In Microsoft Excel #howto #tutorial #msexcel #trending
 0:00:42
Add Labels to Chart Data in Excel
 0:01:33
How to Add data in Origin Plot
 0:08:39
Use Excel's Data Form to add records, edit, delete and search by criteria by Chris Menard
 0:08:54
How to Add Price Data to Your Chart: Tutorial
 0:04:03
How to add data in a spreadsheet
 0:03:54
how to add data in Attribute table
Комментарии