filmov
tv
Comparative Analysis Dashboard in Power BI | Step by Step Design, Data Model, DAX and Publish
Показать описание
#PowerBI #BIDashboards
Hello Friends,
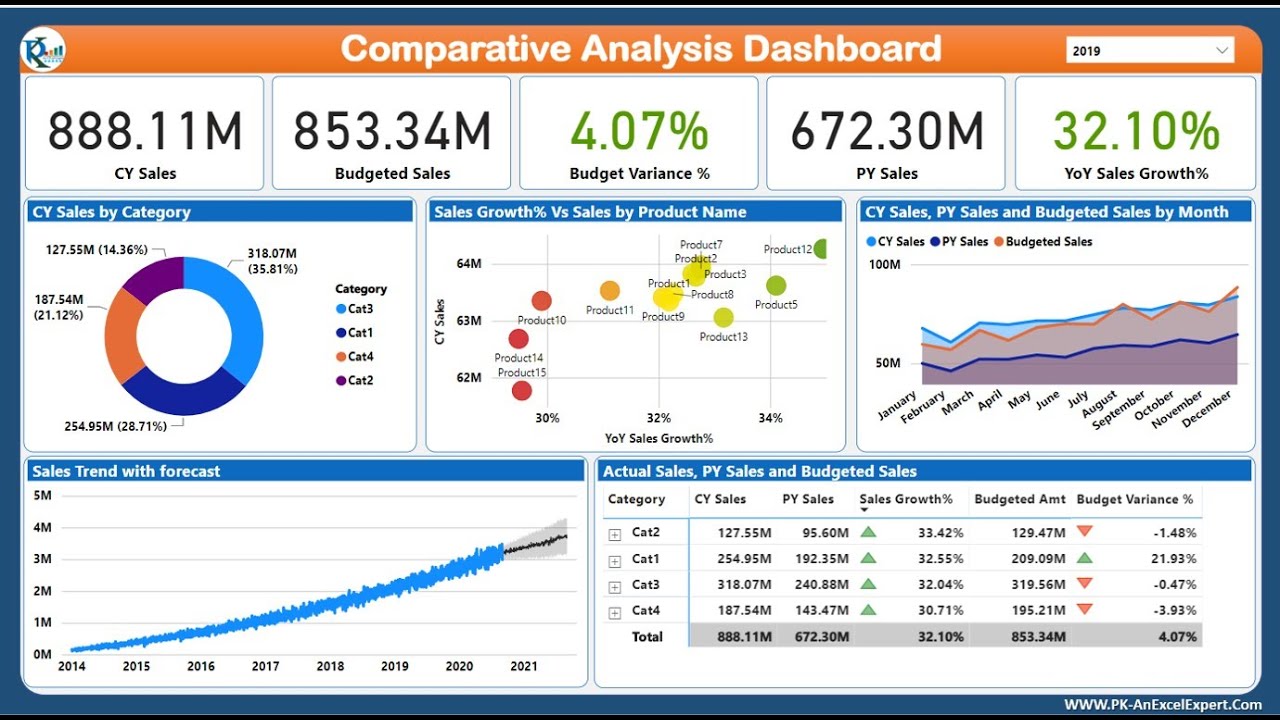
In this video, you will learn how to a beautiful Comparative Analysis Dashboard in Microsoft Power BI.
In this dashboard we have displayed the comparison of Current Year Sales with Previous Year sales and YoY sales growth%. We have displayed the Budgeted Sales data along with Budget Variance%. We have Power BI Tooltip to display Product Level comparison of Sales and Month wise Budget Variance%. We have created the Sales forecast also.
Download the practice files from below given link:
Download the Free Project Management Dashboard
Download our free Excel utility Tool and improve your productivity:
See our Excel Products:
Visit to learn more:
Watch the best info-graphics and dynamic charts from below link:
Learn and free download best excel Dashboard template:
Learn Step by Step VBA:
Website:
Facebook:
Telegram:
Pinterest:
Visit our Amazon Store
Hello Friends,
In this video, you will learn how to a beautiful Comparative Analysis Dashboard in Microsoft Power BI.
In this dashboard we have displayed the comparison of Current Year Sales with Previous Year sales and YoY sales growth%. We have displayed the Budgeted Sales data along with Budget Variance%. We have Power BI Tooltip to display Product Level comparison of Sales and Month wise Budget Variance%. We have created the Sales forecast also.
Download the practice files from below given link:
Download the Free Project Management Dashboard
Download our free Excel utility Tool and improve your productivity:
See our Excel Products:
Visit to learn more:
Watch the best info-graphics and dynamic charts from below link:
Learn and free download best excel Dashboard template:
Learn Step by Step VBA:
Website:
Facebook:
Telegram:
Pinterest:
Visit our Amazon Store
 0:45:05
Comparative Analysis Dashboard in Power BI | Step by Step Design, Data Model, DAX and Publish
 0:30:37
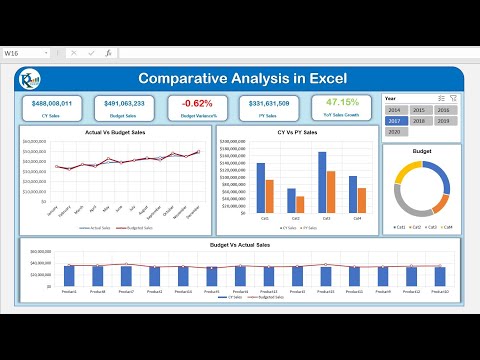
Comparative Analysis Dashboard in Excel
 0:39:01
Comparative Analysis Dashboard in Power BI | Step by Step Design, Data Model | Power BI Dashboard |
 0:10:58
Comparative Analysis Dashboard
 0:04:00
POWER BI Dashboard vs Report
 0:32:33
Basic Financial Analysis Dashboard || Learn Power BI Basics in 30 MINS || POWER BI DASHBOARD ||
 0:00:39
Comparative Analysis Dashboard ll Power BI
 0:15:01
Comparative Sales Analysis Dashboard in MS Excel & Power Pivot (Premium Dashboard)
 2:59:41
Data Viz Presentation( May Term Day-2))
 0:31:20
Power BI Dashboard Project for Business | Build Step by Step KPI Dashboard
 0:13:31
Create a Comparison Report in Power BI
 0:02:49
How to create Line Chart to compare Sales of Multiple Years in PowerBI | MI Tutorials
 0:08:53
PBIVizEdit Comparative Analysis - Power BI Custom Visual
 0:04:34
Current and Historical Data Comparison in Power BI
 0:15:10
How to create Power BI Dashboard (Report) in 7 Minutes in Power BI Desktop | @PavanLalwani
 0:09:21
This Year VS Last Year Time Comparisons & Differences In Power BI
 0:01:51
Compare Month to Month Data in Line Graph in PowerBI | PowerBI tutorial
 0:53:05
Power BI Dashboard | Power Bi Project - Sales Dashboard | Power Bi Tutorial for Beginners
 0:30:37
How to build Dynamic & Interactive Dashboard in EXCEL with Pivot Tables&Charts | Tutorial Ep...
 0:35:23
Quality Analysis Dashboard in Power BI| Design, Data Model, DAX and Publish Complete tutorial
 0:47:44
How to create HR Analytics Dashboard by using Power BI in 30 Mins | Microsoft Power BI Dashboard |
 0:10:06
Revolutionize BI Sales: Power BI Dashboard Design for Mobile
 0:19:21
📊 How to Build Excel Interactive Dashboards
 0:08:34
Product Comparison Sales Analysis Dashboard in Excel - P2
Комментарии