filmov
tv
SPSS: How To Perform Quantitative Data Analyses For Bachelor's Research? 5 Basic Analysis Methods
Показать описание
Intro: (0:00)
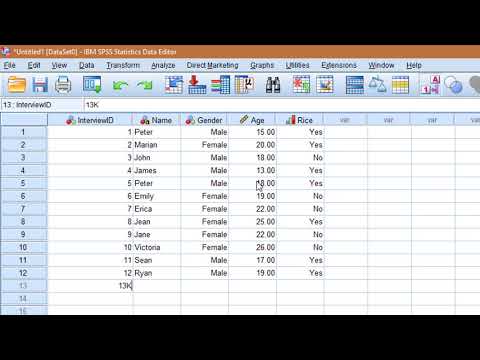
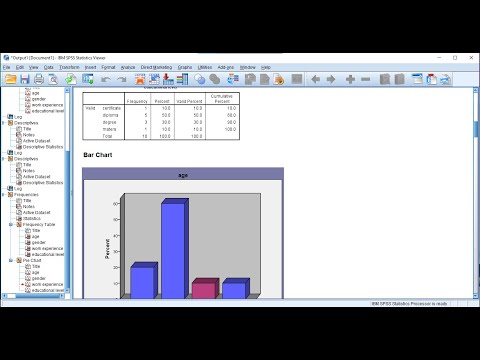
Descriptives: (1:32)
T test: (2:52)
Correlation: (4:41)
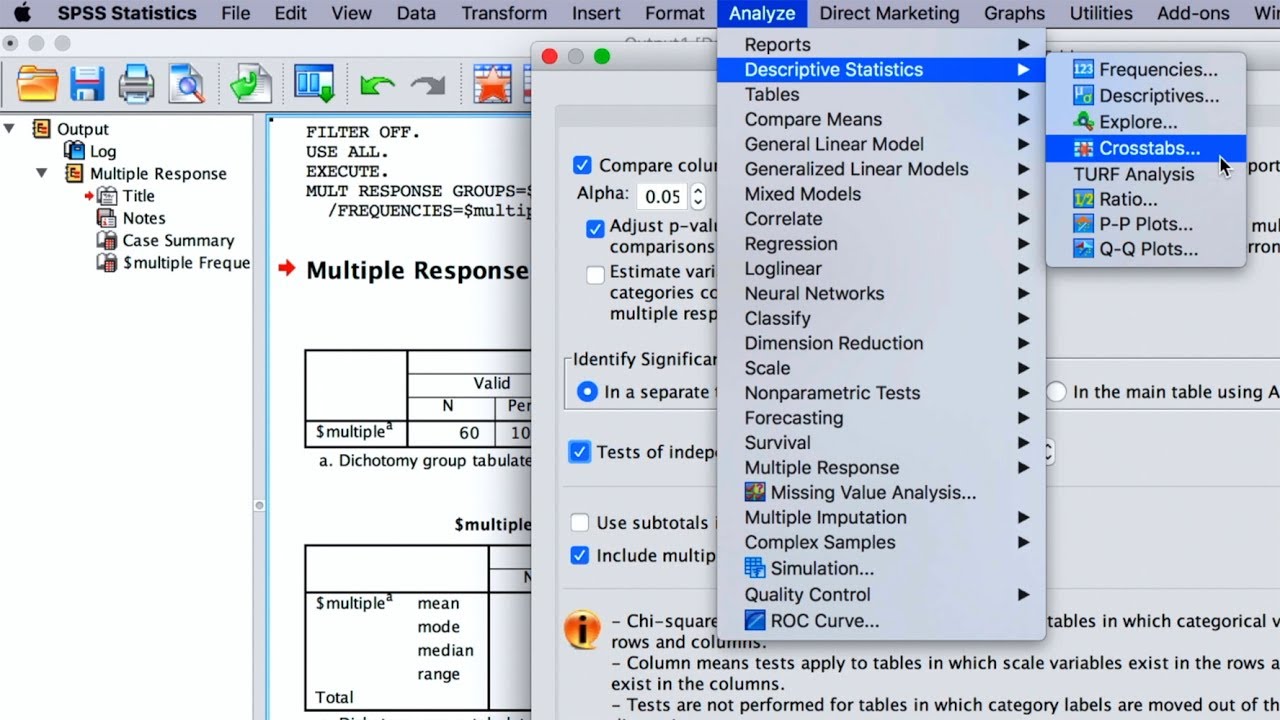
Chi square: (5:39)
Linear regression: (6:45)
This video discusses the basic statistical analytical procedures that are required for a typical bachelor's thesis. Five stats are highlighted here: descriptives, T test, correlation, Chi square, and linear regression.
For requirements on reporting stats, please refer to the appendix of your research module manuals -- Frans Swint and I wrote an instructional text on APA reporting of stats. There is no upper limit in terms of how advanced your stats should be in your bachelor's dissertation. This video covers the basic procedures and is not meant to replace the instructions of your own research supervisor. Please consult your own research advisor for specific questions regarding your data analyses.
Please LIKE this video if you enjoyed it.
Otherwise, there is a thumb-down button, too... :P
▶ Please SUBSCRIBE to see new videos (almost) every week! ◀
▼▼▼Other research videos you might find useful▼▼▼
Examples of Causal, Correlational, Descriptive, and Exploratory Research Questions.
How To Analyze Data In RStudio? Six Bachelor Level Analysis Methods Quickly Demonstrated.
How To Make a Survey for Data Collection? 12 Important Considerations.
How To Defend Your Thesis? Top 10 Tips For Success.
100 Thesis Defense Questions in 3 Categories.
How to Choose Your PhD Supervisor? 6 Key Things to Consider.
What Happens in a University Plagiarism Hearing?
Survey Design: Measure The Variables, Calculate The Effect.
How To Write A Research Proposal? 11 Things To Include In A Thesis Proposal.
How To Enter, Code, And Analyze Multiple Choice Data In SPSS?
5 Basic Quantitative Data Analyses For Bachelor's Research.
How to find academic articles? Google Scholar vs. EBSCOhost.
Research aim, research objective, research question, and investigative question.
Research types, research designs, data collection, and sampling.
How to make a report-ready correlation matrix quickly using SPSS and Excel?
Animations are made with Sparkol.
Music files retrieved from YouTube Audio Library.
All images used in this video are free stock images or are available in the public domain.
The views expressed in this video are my own and do not necessarily reflect the organizations with which I am affiliated.
#RanywayzRandom #SPSS #Research
Descriptives: (1:32)
T test: (2:52)
Correlation: (4:41)
Chi square: (5:39)
Linear regression: (6:45)
This video discusses the basic statistical analytical procedures that are required for a typical bachelor's thesis. Five stats are highlighted here: descriptives, T test, correlation, Chi square, and linear regression.
For requirements on reporting stats, please refer to the appendix of your research module manuals -- Frans Swint and I wrote an instructional text on APA reporting of stats. There is no upper limit in terms of how advanced your stats should be in your bachelor's dissertation. This video covers the basic procedures and is not meant to replace the instructions of your own research supervisor. Please consult your own research advisor for specific questions regarding your data analyses.
Please LIKE this video if you enjoyed it.
Otherwise, there is a thumb-down button, too... :P
▶ Please SUBSCRIBE to see new videos (almost) every week! ◀
▼▼▼Other research videos you might find useful▼▼▼
Examples of Causal, Correlational, Descriptive, and Exploratory Research Questions.
How To Analyze Data In RStudio? Six Bachelor Level Analysis Methods Quickly Demonstrated.
How To Make a Survey for Data Collection? 12 Important Considerations.
How To Defend Your Thesis? Top 10 Tips For Success.
100 Thesis Defense Questions in 3 Categories.
How to Choose Your PhD Supervisor? 6 Key Things to Consider.
What Happens in a University Plagiarism Hearing?
Survey Design: Measure The Variables, Calculate The Effect.
How To Write A Research Proposal? 11 Things To Include In A Thesis Proposal.
How To Enter, Code, And Analyze Multiple Choice Data In SPSS?
5 Basic Quantitative Data Analyses For Bachelor's Research.
How to find academic articles? Google Scholar vs. EBSCOhost.
Research aim, research objective, research question, and investigative question.
Research types, research designs, data collection, and sampling.
How to make a report-ready correlation matrix quickly using SPSS and Excel?
Animations are made with Sparkol.
Music files retrieved from YouTube Audio Library.
All images used in this video are free stock images or are available in the public domain.
The views expressed in this video are my own and do not necessarily reflect the organizations with which I am affiliated.
#RanywayzRandom #SPSS #Research
 0:08:32
SPSS: How To Perform Quantitative Data Analyses For Bachelor's Research? 5 Basic Analysis Metho...
 0:15:15
Learn SPSS in 15 minutes
 0:26:12
HOW TO ANALYZE QUANTITATIVE DATA USING SPSS.
 0:00:45
SPSS - Mean, Median, Mode, Standard Deviation & Range
 0:08:16
Learn SPSS data analysis, interpretation and APA reporting for beginners in 7 minutes
 0:25:27
02. Descriptive Analysis Using SPSS for Quantitative Variable
 0:08:02
Enter data and define variables in SPSS
 0:01:45
SPSS tutorial 5: How to do Descriptive Analysis
 0:15:14
Quantitative Research
 0:13:38
SPSS: How to enter and analyze data from a questionnaire
 2:08:56
Quantitative Data Analysis using SPSS
 0:04:27
SPSS Questionnaire/Survey Data Entry - Part 1
 0:10:16
01 How to Use SPSS - An Introduction to SPSS for Beginners
 0:08:01
How to use ChatGPT to analyze data in SPSS
 0:31:03
SPSS: How to Analyse and Interpret LIKERT-SCALE Questionnaire Using SPSS
 0:28:14
Quantitative Data Analysis 101 Tutorial: Descriptive vs Inferential Statistics (With Examples)
 1:42:34
Quantitative Data Analysis with SPSS
 1:59:35
SPSS course for beginners: Stats basics, creating variables, data entry, descriptive stats
 0:03:56
How to Compute or Calculate a Score in SPSS
 0:09:09
SPSS Hypothesis test (One-sample T Test)
 0:04:53
SPSS - Independent Samples t-Test
 0:22:52
Introduction to SPSS Software for Beginners (Part 1)
 0:01:00
How to quickly run analyses in SPSS
 0:12:36
Running, Interpreting, and Reporting Descriptive Statistics using SPSS
Комментарии