filmov
tv
Add New Variable to Data Frame Based On Other Columns in R (2 Examples) | $ Operator | transform()

Показать описание
R code of this video:
x2 = c(3, 1, 3, 4, 2, 5))
data_new1 <- data # Duplicate example data
data_new1$x3 <- data_new1$x1 + data_new1$x2 # Add new column
data_new2 <- data # Duplicate example data
data_new2 <- transform(data_new2, x3 = x1 + x2) # Add new column
Follow me on Social Media:
x2 = c(3, 1, 3, 4, 2, 5))
data_new1 <- data # Duplicate example data
data_new1$x3 <- data_new1$x1 + data_new1$x2 # Add new column
data_new2 <- data # Duplicate example data
data_new2 <- transform(data_new2, x3 = x1 + x2) # Add new column
Follow me on Social Media:
 0:05:06
Add New Variable to Data Frame Based On Other Columns in R (2 Examples) | $ Operator | transform()
 0:02:40
Data management: How to create a new variable that is calculated from other variables
 0:03:36
Creating a New or Combined Variable Using SPSS
 0:02:49
How to Add a New Variable to an Existing Data Set in R. [HD]
 0:03:22
Create New Variable from Existing Variables in R
 0:04:16
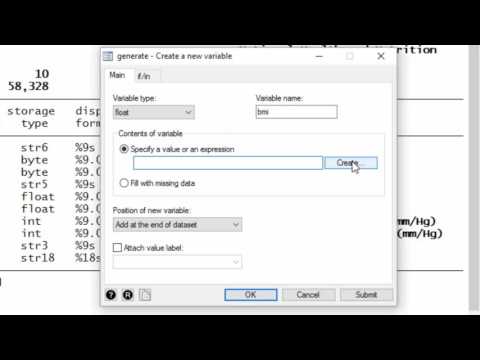
how to generate a new variable in Stata
 0:02:34
Create new variable in PSPP based on existing variables (computer means of existing variable)
 0:06:48
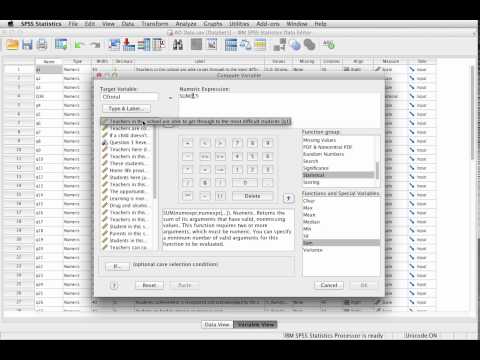
Creating a New Variable using SPSS
 6:17:27
Build Python Algorithms For Cybersecurity - Python Tutorial
 0:01:08
Create a new variable in R
 0:04:28
Recode scale variable into categories in SPSS
 0:02:30
Creating New Variable in SAS | Creating a New Variable in Existing Data in Excel VS SAS
 0:01:36
Computing a New Variable in SPSS
 0:10:32
create new variable using STATA
 0:02:04
Creating new variable based on other variables in SPSS
 0:04:54
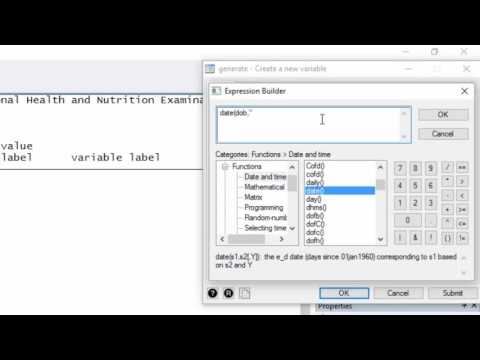
Data management: How to create a date variable from a string
 0:09:04
Variable data, text and images in Adobe Illustrator CC
 0:03:15
Recode multinomial variable into new binary variable in SPSS
 0:03:02
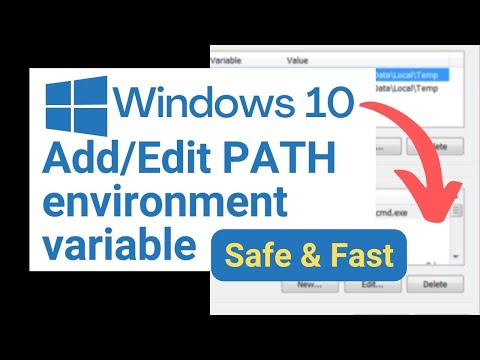
Add/edit PATH environment variable in Windows 10
 0:02:18
Transforming an Ordinal Variable to Numeric in Excel
 0:04:03
Create a Two Variable Data Table Excel 2016
 0:04:08
Lesson 3 - Creating new Variable or Column in SAS dataset.
 0:04:52
Qlik Sense tutorial : Adding a list to Variable input using variables in Qlik Sense
 0:03:34
Data management: How to convert a string variable to a numeric variable
Комментарии