filmov
tv
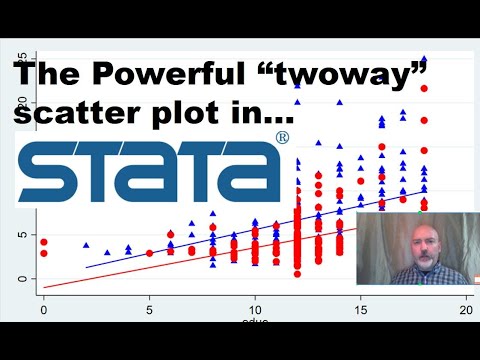
Graphs in STATA: Scatterplot

Показать описание
In this playlist, we'll take a look at different kinds of data visualization tools in STATA. We start with a sample dataset for our tutorial and in each separate video we discuss different types of graphing techniques, such as: line plots, connected line plots, scatter plots with linear fits, scatter plot matrix, histogram with normal and kernel density plots, boxplots and combining graphs.
Tags:
#economics #math #stata #rstudio #r #python #optimization #dataanalysis #data #dataset #bigdata #statistics #proof #microeconomics #macroeconomics #econometrics #graps #visualization #coding #input #output #modelling #inputoutput #multiplier #pythonprogramming #pythontutorial #economy #reading #processing #régression #regression #logit #valuation #finance #financialeducation #excel #exceltutorial #pivot_table #timeseriesanalysis #timeseries #panel #population #sample #hypothesis #hypothesistesting #public #publication #proof #realanalysis #calculus #probability #supplychain
 0:05:15
 0:03:11
 0:05:40
 0:02:14
 0:06:03
 0:05:27
 0:09:09
 0:04:53
 0:06:03
 0:01:44
 0:07:21
 0:03:16
 0:02:01
 0:11:08
 0:09:16
 0:04:47
 0:08:17
 0:00:55
 0:15:02
 0:04:53
 0:03:28
 0:03:50
 0:23:54
 0:07:11