filmov
tv
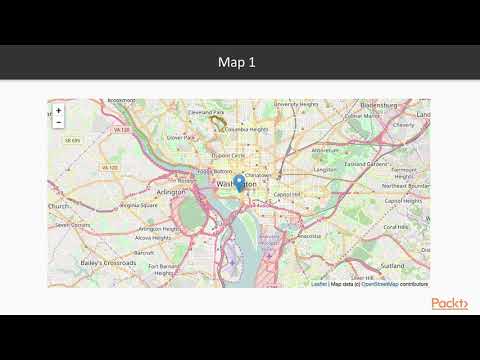
Python Maps with mplleaflet

Показать описание
Convert Matplotlib Plots into Leaflet Maps using mplleaflet.
In this Python programming tutorial, we will go over how to create a matplotlib plot and then overlay the plot onto a leaflet map. Examples include: planning a route, plotting locations, overlaying a scatter plot, and combining geographic boundaries with a leaflet map.
In this Python programming tutorial, we will go over how to create a matplotlib plot and then overlay the plot onto a leaflet map. Examples include: planning a route, plotting locations, overlaying a scatter plot, and combining geographic boundaries with a leaflet map.
 0:09:00
Python Maps with mplleaflet
 0:44:24
Mapping in Python: Basemap, Cartopy, Mplleaflet and Folium
 0:01:51
Spatial plotting of locations using Jupyter notebook
 0:07:59
Jupyter In Depth : Ipyleaflet | packtpub.com
 0:16:31
Python. Plotly, Folium, Highcharts, Basemap, Vincent, Bokeh.
 0:00:41
Great Lake Basin map Streamflow ipyleaflet Jupyter Notebook Google Chrome 2019 11 09 14 21
 0:04:21
Creating Interactive Maps - Python
 0:18:50
Python - Create Maps with Folium and Leaflet
 0:33:25
Python Maps with ipyleaflet
 0:21:07
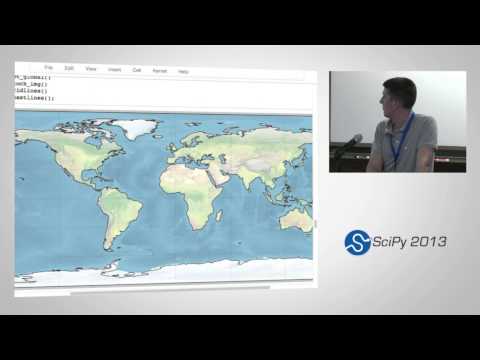
Iris & Cartopy: Python packages for Atmospheric and Oceanographic science; SciPy 2013 Presentati...
 0:01:05
HTML : Python NetworkX/Mplleaflet: network to geojson
 0:17:46
maps in python with folium
 0:13:34
Python Geographic Maps with Matplotlib Basemap
 0:08:55
Creating your first python folium map (Best Folium and Python Tutorial)
 0:08:06
MetPy Mondays #57 - Pandas CSV and Mapping
 0:07:34
Introduction to Maps in Folium and Python
 0:05:59
Followers and Communities on Twitter: 7- Folium - maps made easy with Python - part 1
 0:00:49
How to Use Basemaps and How to Set Custom Basemaps in MLinkPlanner 1.2
 0:34:35
PyDX 2015: Python, Geodata and Maps
 0:15:00
Understanding map projections | python | #pyGuru
 0:30:17
Creating map visualizations with open data and Folium - PyConSG 2016
 0:08:04
Tiles von OpenStreetMap für Leaflet herunterladen
 0:05:48
Followers and Communities on Twitter: 7- Folium - maps made easy with Python - part 2
 0:13:21
Python Introduction to Cartopy
Комментарии