filmov
tv
Forecast Accuracy Formula: 4 Easy Calculations in Excel

Показать описание
How to Track & Improve Forecast Accuracy? 🎯
In my new YouTube Video, I released a step-by-step tutorial with 4 straightforward forecast accuracy formulas in Excel.
No matter if you forecast sales, new product launches, production demand...
My goal is for you to improve your forecast accuracy.
And make it simple to boost your performance.
As always, you can download an Excel template to start measuring forecast accuracy immediately with your company 🚀
Enjoy this video, and let me know how you track and improve your forecasting accuracy KPIs!
▬▬▬▬▬▬▬▬▬▬▬ CHAPTERS ▬▬▬▬▬▬▬▬▬▬▬▬
00:00 Intro
00:26 Why is Forecast Accuracy Important?
01:55 Have a Forecast
03:25 Define a Forecast Horizon
05:25 Save Historical Forecasts & Demand
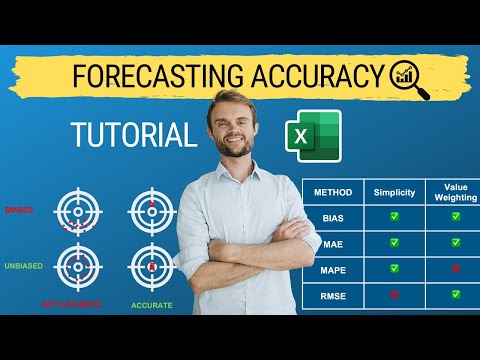
08:24 Choose a Calculation Method
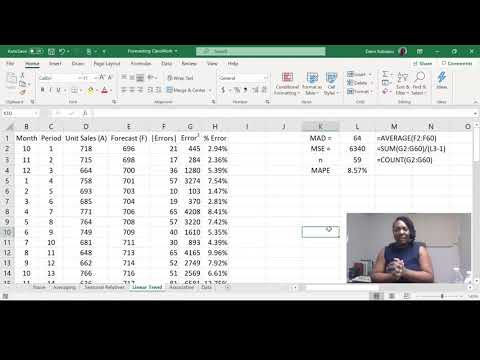
10:05 BIAS in Excel
11:52 MAE in Excel (Mean Absolute Error)
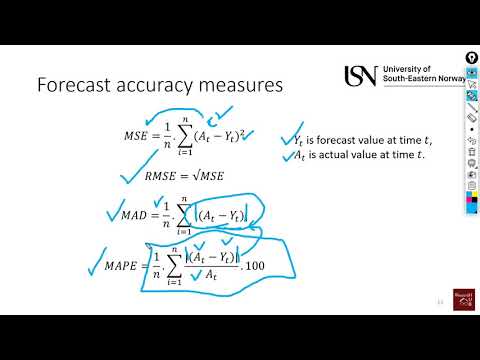
14:08 MAPE in Excel (Mean Absolute Percentage Error)
15:44 RMSE in Excel (Root Mean Square Error)
18:15 Forecast Accuracy Method Comparison
20:16 How to Improve Forecast Accuracy?
#demandforecasting #forecastaccuracy
 0:20:47
Forecast Accuracy Formula: 4 Easy Calculations in Excel
 0:08:58
Forecast accuracy mape bias [Excel 2021]
 0:03:19
Methods to Calculate Forecast Accuracy
 0:04:52
Forecasting: Moving Averages, MAD, MSE, MAPE
 0:11:08
Forecast Accuracy in Excel
 0:09:20
Ch04. Forecasting (5) Forecasting Accuracy Measures
 0:06:04
03_01_P2 Measures of Forecast Error Using Excel
 0:04:35
Forecasting (7): Forecast accuracy measures (MSE, RMSE, MAD & MAPE)
 0:01:42
Forecast Accuracy Mean Average Percentage Error (MAPE)
 0:05:35
Forecast Accuracy
 0:10:45
Forecasting Techniques : Moving Average, MAD, MSE,MAPE
 0:05:31
The Excel FORECAST Function
 0:20:01
Forecast accuracy and Forecast Bias%, what is the difference?
 0:05:24
Forecast Accuracy & Time Series Regression | SCMT 3623
 0:05:42
Forecasting in Excel Made SIMPLE (include seasonality & make predictions)
 0:53:47
Webinar 'Forecasting Accuracy' by Prof. dr. Ger Koole - CCmath
 0:30:45
Forecast Accuracy Forecasting | Operations Management Lecture #13 | FREE Tutorial! | So Easy! 🙂🤩...
 0:09:46
Forecast Accuracy Measures with Excel | Dr. Harper's Classroom
 0:07:02
Exponential Smoothing Method in Forecasting | Forecasting Techniques - Exponential smoothing method
 0:08:21
Forecast Accuracy
 0:00:41
How do you measure forecast accuracy?
 0:08:43
Operations Management: Forecast Errors (MSE, MAD, MAPE)
 0:01:33
Forecast Accuracy: Mean Absolute Error (MAE)
 0:04:49
Improving Accuracy in Business Forecasting
Комментарии