filmov
tv
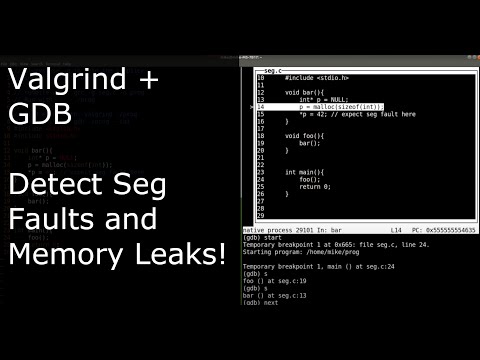
Using GDB and Valgrind together to find Memory Leaks

Показать описание
Here I explain a simple C program with a memory leak and how to use GDB and Valgrind together to find leaks.
Please let me know if you have any questions!
Please let me know if you have any questions!
 0:10:28
Using GDB and Valgrind together to find Memory Leaks
 0:06:01
C++ Weekly - Ep 453 - Valgrind + GDB Together!
 0:13:25
Using Valgrind and GDB together to fix a segfault and memory leak
 0:02:44
Debugging crash using gdb and valgrind
 0:24:42
Debugging memory issues with Valgrind and GDB - DevConf.CZ 2023
 0:04:43
GDB and Valgrind - A Brief Introduction (Part 1)
 0:07:29
GDB is REALLY easy! Find Bugs in Your Code with Only A Few Commands
 0:03:10
Debugging MPI programs with Valgrind, GDB, and TMPI
 0:02:58
Finding memory errors with Valgrind
 0:12:40
Debugging with GDB and Valgrind
 0:07:54
GDB and Valgrind - A Brief Introduction (Part 2)
 0:36:26
Debugging with GDB + Valgrind
 0:40:03
Make, GDB, and Valgrind
 0:54:36
ARC GDB/Valgrind Software Seminar, Spring 2019
 0:11:45
Pitfalls of Pointers (and using address sanitizer and gdb to find them) | Modern Cpp Series Ep. 29
 0:09:04
Exercise solution + hints on GDB and valgrind in video
 0:24:54
How to use valgrind
 0:17:26
Software Development with C++: Debugging with Valgrind
 0:17:51
C Dynamic Memory Debugging with Valgrind
 0:10:03
Valgrind, GDB, and friends - Part 6 / 15
 0:00:47
Using Valgrind to fix bug
 0:11:09
Fix Memory Leaks in C Code with Valgrind
 0:07:15
How to use GDB Debugger to Fix Seg Faults!
 0:09:16
Debugging with Core Dumps
Комментарии