filmov
tv
Debugging memory issues with Valgrind and GDB - DevConf.CZ 2023

Показать описание
Speaker(s): Alexandra Petlanova Hajkova
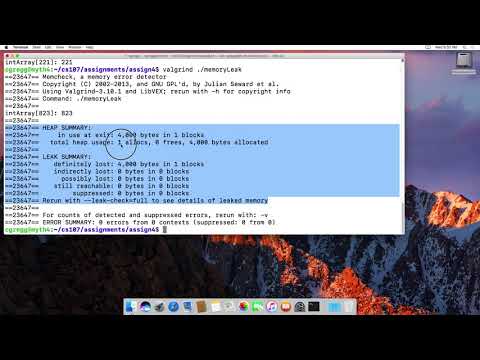
Buffer overflows, memory leaks, and similar memory issues plague many C and C++ programs. Valgrind is a sophisticated utility for finding low-level programming errors, particularly involving memory use. The GNU Project Debugger (GDB), is a popular tool for use with C/C++ and other languages. We'll show how in the latest Fedora distro they can be used together and how you can get debuginfo for all your system libraries automatically.
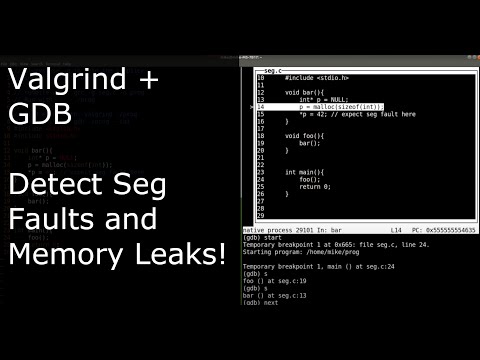
I'll show how to use Valgrind and GDB together. It used to be a bit cumbersome to setup them up together. But through recent work upstream and in Fedora it's possible to run gdb as normal, type target valgrind, and start debugging the program which now automatically runs under valgrind inside Gdb. We'll demo finding and debugging memory issues like undefined memory, accessing freed memory and memory leaks all from gdb using the information valgrind provides.
Buffer overflows, memory leaks, and similar memory issues plague many C and C++ programs. Valgrind is a sophisticated utility for finding low-level programming errors, particularly involving memory use. The GNU Project Debugger (GDB), is a popular tool for use with C/C++ and other languages. We'll show how in the latest Fedora distro they can be used together and how you can get debuginfo for all your system libraries automatically.
I'll show how to use Valgrind and GDB together. It used to be a bit cumbersome to setup them up together. But through recent work upstream and in Fedora it's possible to run gdb as normal, type target valgrind, and start debugging the program which now automatically runs under valgrind inside Gdb. We'll demo finding and debugging memory issues like undefined memory, accessing freed memory and memory leaks all from gdb using the information valgrind provides.
 0:02:58
 0:11:12
 0:11:09
 0:24:42
 0:13:25
 0:17:51
 0:28:20
 0:10:21
 0:13:29
 0:05:42
 1:30:46
 0:24:54
 0:02:44
 0:07:07
 0:06:34
 0:36:26
 0:07:39
 0:17:26
 0:15:31
 0:09:44
 0:08:31
 0:05:40
 0:03:03
 0:10:47