filmov
tv
Sensitivity Analysis - Microsoft Excel
Показать описание
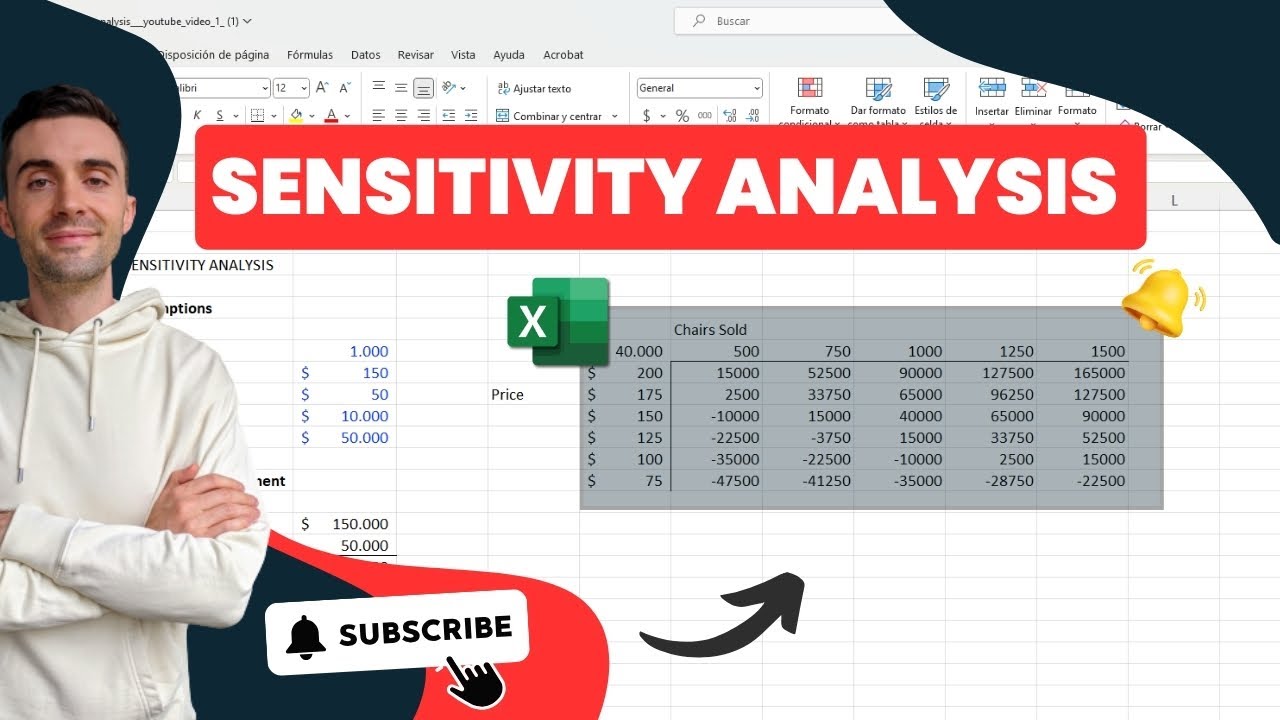
Example of how to build a sensitivity analysis table in Excel to evaluate how changing two inputs simultaneously will affect an output (profit). This is one of the functions in the "What-If-Analysis" section of Excel.
Communities:
Related Finance Videos:
▬▬▬▬▬▬▬▬▬▬▬▬▬▬▬▬▬▬▬▬▬▬▬▬▬▬▬▬▬▬▬▬▬▬▬▬▬▬▬▬
Sensitivity analysis in Excel is one of the skills that separates the common Excel user from the power user.
Often we try to analyze business problems by thinking about what will happen if certain things change. For instance, what happens if we change the price? Well, the revenue would go up if we just change the price, but the total customers stay the same...but does that make sense?
The reality is that you never have scenarios where one variable changes and everything else stays the same. Variables all change when you change one thing. When you raise the price, usually some customers will stop buying, and some won't.
So when trying to analyze situations, it is better to try to build models and analyses that reflect many different variables changing at the same time.
This is where sensitivity analysis comes in. Using this Excel feature, we are able to examine how multiple changing variables will affect different business metrics. To do this, we can build a "sensitivity data table" to examine the range of possible outcomes.
In this tutorial, we learn how to build a sensitivity analysis table in Excel 2016 to evaluate how changing two inputs simultaneously will affect an output (profit).
#sensitivityanalysis #excel
 0:04:23
Sensitivity Analysis - Microsoft Excel
 0:15:59
Sensitivity Analysis using MS Excel - Fully Explained
 0:10:09
Sensitivity analysis in Excel
 0:04:25
Sensitivity Tables in Excel - Financial Modeling, Investment Banking, Private Equity, LBO
 0:08:42
Excel What-If Analysis Data Table | Easy to Use Once you Learn This☝️
 0:08:01
Sensitivity Analysis Using Excel | One and Two Variable Data Tables
 0:07:00
Linear Programming Sensitivity Analysis - Interpreting Excel's Solver Report
 0:03:24
Sensitivity Analysis Using Excel
 0:10:37
121. Microsoft Power BI PL-300 Exam Preparation - Practice Questions (Part 4)
 0:01:40
Sensitivity Analysis-Microsoft Excel
 0:00:39
Sensitivity Analysis Ms Excel
 0:03:33
Sensitivity analysis chart in excel / Tornado Chart / Stacked bar chart
 0:08:04
Interpreting Solver Sensitivity Report
 0:07:28
SENSITIVITY ANALYSIS with Data Table in Excel | ExcelJunction.com
 0:14:06
Sensitivity Analysis - Come utilizzare la Table di Excel per il Modelling Finanziario
 0:18:08
Data Sensitivity Analysis in Excel - What If Data Tables
 0:00:11
DCF Sensitivity Analysis with Excel Data Table
 0:03:58
Sensitive Analysis on Excel
 0:19:24
Generating Sensitivity Analysis Report Using MS Excel Made Easy!!_Sensitivity Report Analysis_Part 2
 0:03:03
Interpreting Sensitivity Analysis on Excel Solver
 0:05:46
Sensitivity Analysis in MS Excel | Corporate Finance Institute
 0:04:41
Sensitivity Analysis - Microsoft Excel
 0:07:21
generating Sensitivity Analysis using Microsoft Excel Solver
 0:05:09
Decision Analysis - Sensitivity Analysis | Find p | Draw Graph | Data Table in Excel
Комментарии