filmov
tv
Data Visualization: Then and Now

Показать описание
With Vitaliy Rudnytskiy, SAP
Data Visualization is the new old topic. Surprisingly its history is not that long even if spreadsheets made data exploration ubiquitous. But as Data is moving into 3xV directions (Volume, Velocity and Variety) so is modern Visualization of it. After going through a bit of a theory we will move into practical aspects of Data Storytelling and Exploratory Data Analysis.
As an SAP Developer Advocate Vitaliy Rudnytskiy focuses on all ways developers are collecting data and turning it into value using the SAP Business Technology Platform. His main interests are in big data and fast data technologies, IoT, analytics, and data visualization.
 0:58:41
Data Visualization: Then and Now
 0:15:50
The Evolution Of Data Visualization | Dustin Cabral | TEDxBryantU
 0:11:02
Data Visualization in 2024 | The Ultimate Guide
 0:00:40
Data Visualization Tip: Start with 0 💡 #codebasics #shorts #dataanalysis #data
 1:10:23
Excel Data Visualization Course – Guide to Charts & Dashboards
 0:00:31
Data analytics VS Data visualization...
 0:00:38
Data Visualization Tip: Start Your Chart With ZERO
 0:00:25
Data Visualization #short
 0:29:43
Mastering Charts and Graphs: Excel for Beginners Part 06
 0:00:56
Data Visualization Hack: 10 Second Rule #shorts
 0:18:11
Visualize your data using ggplot. R programming is the best platform for creating plots and graphs.
 0:35:45
Next in Data Visualization | Michelle Borkin || Radcliffe Institute
 0:45:42
The Recipe for Powerful Data Visualization | Google Data Analytics Certificate
 0:08:23
Data Visualization 101: 5 Tableau Charts to Help Tell Your Data Story | Salesforce Explained
 0:06:09
Data Visualization: 9 Actionable Tips You Can Use Now
 0:11:13
7 Top Tips for Better Business Dashboard Design Data Visualization | BI For Beginners
 0:54:10
The Beautiful Science of Data Visualization
 1:00:29
Introduction: Advanced Data Visualization: Techniques, Interaction, and Data Patterns
 0:00:31
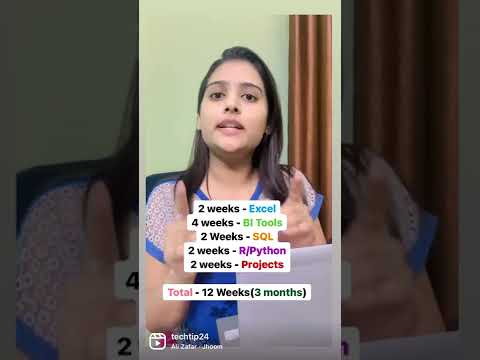
Data Analytics 3 months roadmap #dataanalytics #datascience #upgradeskill #livetraining
 0:25:36
Top 10 Data Visualization Tools in 2024 | Best Tools for Data Visualization | Edureka
 0:11:43
Data Visualization
 0:25:36
Top 10 Data Visualization Tools in 2023 | Best Tools for Data Visualization | Edureka Rewind
 1:02:05
Effective Data Visualisation - with Valentina D'Efilippo
 1:05:17
Time: Advanced Data Visualization: Techniques, Interaction, and Data Patterns - with Robert Kosara
Комментарии