filmov
tv
Plotly library part:05 line plot | data science |exploratory data analysis | tips data

Показать описание
Hello everyone,
In this video I have told you how to make a line plot using plotly library and add more features in it. I had taken the tips dataset which comes under the plotly library .So basically these programs are written with the help of python programming language .
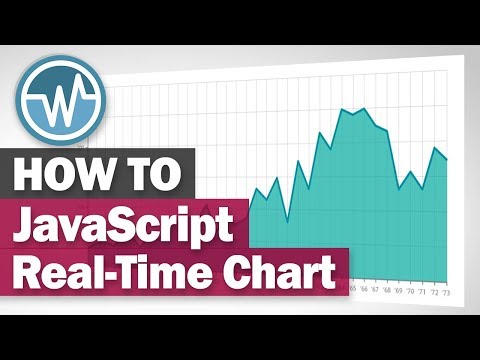
What is a line plot/graph ?
A line chart or line graph is a type of chart which displays information as a series of data points called ‘markers’ connected by straight line segments.
Line graphs are usually used to find relationship between two data sets on different axis; for instance X, Y.
Ever wonder the difference between Plotly Express and Graph Objects? Learn all about Plotly , so you can create powerful graphs, charts, and plots.
The most in demand skills in the world right now are in Data Science & Machine Learning! I will teach you everything imaginable about Data Science & Machine Learning including all the math, libraries, algorithms so that rather then playing with it on an elementary level you will Master it! The journey will be hard, but those willing to put in the time and brain power will be rewarded in the end.
Don't forget to like, subscribe and share the channel. Do press the bell icon so that you don't miss any update !!
-------------------------------------------------------------------------------------------------
-----------------------------------------------------------------------------------------------------
---------------------------------------------------------------------------------------------------------------------------
-------------------------------------------------------------------------------------------------------------------------------
---------------------------------------------------------------------------------------------------------------------------
--------------------------------------------------------------------------------------------------------------------------
---------------------------------------------------------------------------------------------------------------------------
---------------------------------------------------------------------------------------------------------------------------
---------------------------------------------------------------------------------------------------------------------------
--------------------------------------------------------------------------------------------------------------------------
--------------------------------------------------------------------------------------------------------------------------
Link for the recorded online classes playlist :
--------------------------------------------------------------------------------------------------------------------
Link for the pandas playlist :
---------------------------------------------------------------------------------------------------------------------
#datascience #exploratorydataanalysis #dataanalysis #python #library #pythonlibrary
In this video I have told you how to make a line plot using plotly library and add more features in it. I had taken the tips dataset which comes under the plotly library .So basically these programs are written with the help of python programming language .
What is a line plot/graph ?
A line chart or line graph is a type of chart which displays information as a series of data points called ‘markers’ connected by straight line segments.
Line graphs are usually used to find relationship between two data sets on different axis; for instance X, Y.
Ever wonder the difference between Plotly Express and Graph Objects? Learn all about Plotly , so you can create powerful graphs, charts, and plots.
The most in demand skills in the world right now are in Data Science & Machine Learning! I will teach you everything imaginable about Data Science & Machine Learning including all the math, libraries, algorithms so that rather then playing with it on an elementary level you will Master it! The journey will be hard, but those willing to put in the time and brain power will be rewarded in the end.
Don't forget to like, subscribe and share the channel. Do press the bell icon so that you don't miss any update !!
-------------------------------------------------------------------------------------------------
-----------------------------------------------------------------------------------------------------
---------------------------------------------------------------------------------------------------------------------------
-------------------------------------------------------------------------------------------------------------------------------
---------------------------------------------------------------------------------------------------------------------------
--------------------------------------------------------------------------------------------------------------------------
---------------------------------------------------------------------------------------------------------------------------
---------------------------------------------------------------------------------------------------------------------------
---------------------------------------------------------------------------------------------------------------------------
--------------------------------------------------------------------------------------------------------------------------
--------------------------------------------------------------------------------------------------------------------------
Link for the recorded online classes playlist :
--------------------------------------------------------------------------------------------------------------------
Link for the pandas playlist :
---------------------------------------------------------------------------------------------------------------------
#datascience #exploratorydataanalysis #dataanalysis #python #library #pythonlibrary
 0:14:55
 0:15:18
 0:00:25
 0:04:03
 0:00:17
 0:11:50
 0:10:51
 0:06:56
 0:01:36
 0:15:03
 0:00:46
 1:22:52
 0:00:08
 0:00:16
 0:00:15
 0:12:24
 0:00:20
 1:05:33
 0:00:16
 0:06:38
 0:00:48
 0:29:21
 0:32:33
 0:05:56