filmov
tv
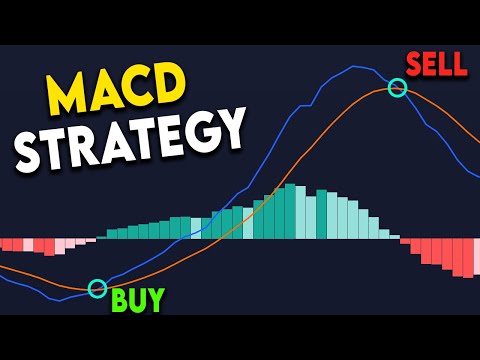
Simple MACD + 200 EMA Trading Strategy Tested 900x Times

Показать описание
Wecome to TradeSmart.
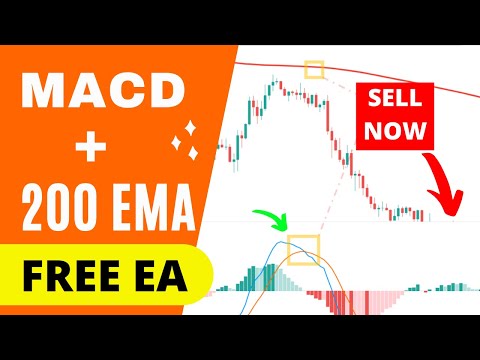
In this video we are going to test a SIMPLE MACD + 200 EMA trend following pullback strategy in total of 900 times.
Link to Trade Pro's channel:
We are going to test the strategy on the:
5 min
15 min
30 min
timeframe charts with a risk to reward of:
1:1
2:1
3:1
to see which combination will give us the best results!
If you want to see more trading strategies tested a 100 times or more SUBSCRIBE hit the notification bell and let me know which strategy should I test in the next video.
If you liked this video drop a like for the YouTube algorithm. Thank you!
Stay tuned!
We have just launched our Discord channel! If you want to join, first go to our Patreon page and become a tier member. Then follow the instructions and you're done.
You can also get access to our Premium Scripts and tutorial videos by becoming a Smart Trader Tier member.
Thank you all for your support and see you in the Discord channel!😊
The information on this channel is for entertainment purposes only. It is not intended as financial or investment advice and should not be construed or relied on as such. Before making any commitment of a legal or financial nature you should seek advice from a qualified and registered legal practitioner or financial or investment adviser.
----------------------------------------------------------------------------------------------------------------------
Consider using our Affiliate/Referral links for signing up to Brokers and Trading Bot Automation services and recieve bonuses. Thank you!:
Pionex (20% rebate from trading fees):
3Commas (10% discount):
Wundertrading (10% discount on any one-month subscription plan):
TradigView ($30 worth of coins):
Binance:
ByBit:
3Commas (10% discount):
--------------------------------------------------------------------------------------------------------------------------
Other strategy tests:
 0:15:56
Simple MACD + 200 EMA Trading Strategy Tested 900x Times
 0:07:06
BEST MACD Trading Strategy [86% Win Rate]
 0:06:12
Simple Trading Strategy Made 4000$ in 30days - MACD + 200EMA
 0:08:49
I Tested MACD + 200 EMA Trading Strategy with a Free Expert Advisor - MACD Indicator Explained
 0:10:07
70% Win Rate Highly Profitable MACD + Parabolic SAR + 200 EMA Trading Strategy (Proven 100 Trades)
 0:09:47
Easy MACD x 200 EMA Strategy
 1:01:13
MACD 200 EMA Strategy Tested 122 times (FULL VIDEO)
 0:37:50
MACD + 200 EMA Trading Strategy Tested 100 Times With 1:2 RR
 0:14:01
MACD + CMF + 200 EMA Trading Strategy Tested 100 Times with Great Results!
 0:03:18
MACD RSI Strategy + 200 EMA Tested 100 Times
 0:09:22
This Simple MACD Trading Strategy Made $301,000 In 2022!
 0:05:46
MACD Scalping: Your Ticket to Fast and Easy Trading Wins!
 0:15:56
Simple MACD + 200 EMA Trading Strategy
 0:04:01
200 EMA + MACD Trading Strategy Tested 100 Times With 3:1 RR
 0:13:06
MACD + 200 EMA Awesome Trading Strategy
 0:09:49
Most Effective MACD Strategy for Daytrading Crypto, Forex & Stocks (High Winrate Strategy)
 0:24:16
Trade the MACD/200 EMA Strategy on Short (15 min) Time Frame
 0:05:25
MACD Trading Strategy 200 Times! Full Results
 0:05:11
Simple Profitable Trading Strategy Tested 100 Times - MACD + EMA
 0:14:21
Best MACD Indicator Settings YOU NEED TO KNOW!!!
 0:08:28
MACD Indicator | MACD Trading Strategy | Best MACD Trading Strategy | MACD+200 EMA
 0:18:09
MACD + 200EMA STRATEGY - IN DEPTH BACKTEST AND ANALYSIS
 0:00:54
MACD and 200 EMA Strategy | Day Trading Strategy
 0:13:11
30 Minute Time Frame Entry for the 200 EMA and MACD Forex Trading System
Комментарии