filmov
tv
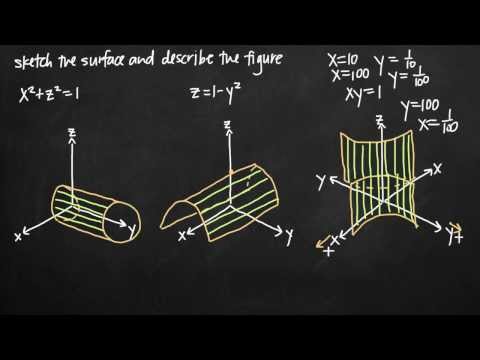
Visualizing 3-D Graphs through Level Curves

Показать описание
Edits:
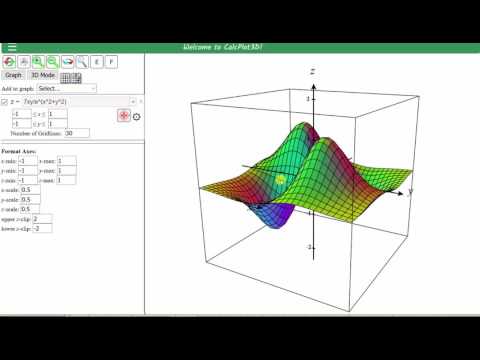
at about 6:18... I mixed up which axis is which... the red one is the x-axis and the green is the y-axis.
at about 7:56... When looking from above with this graphing calculator, it looks like the domain is a circle. Clearly that is not the case. It just appears that way because they could not make the bowl infinitely tall, so it had to be cut off somewhere.
 0:09:55
 0:07:54
 0:08:05
 0:07:09
 0:02:41
 0:03:17
 0:07:06
 0:02:20
 3:10:26
 0:15:12
 0:02:17
 0:01:34
 0:01:01
 0:10:16
 0:04:40
 0:23:06
 0:05:38
 0:05:02
 0:00:19
 0:01:12
 0:22:56
 0:19:13
 0:04:28
 0:02:04