filmov
tv
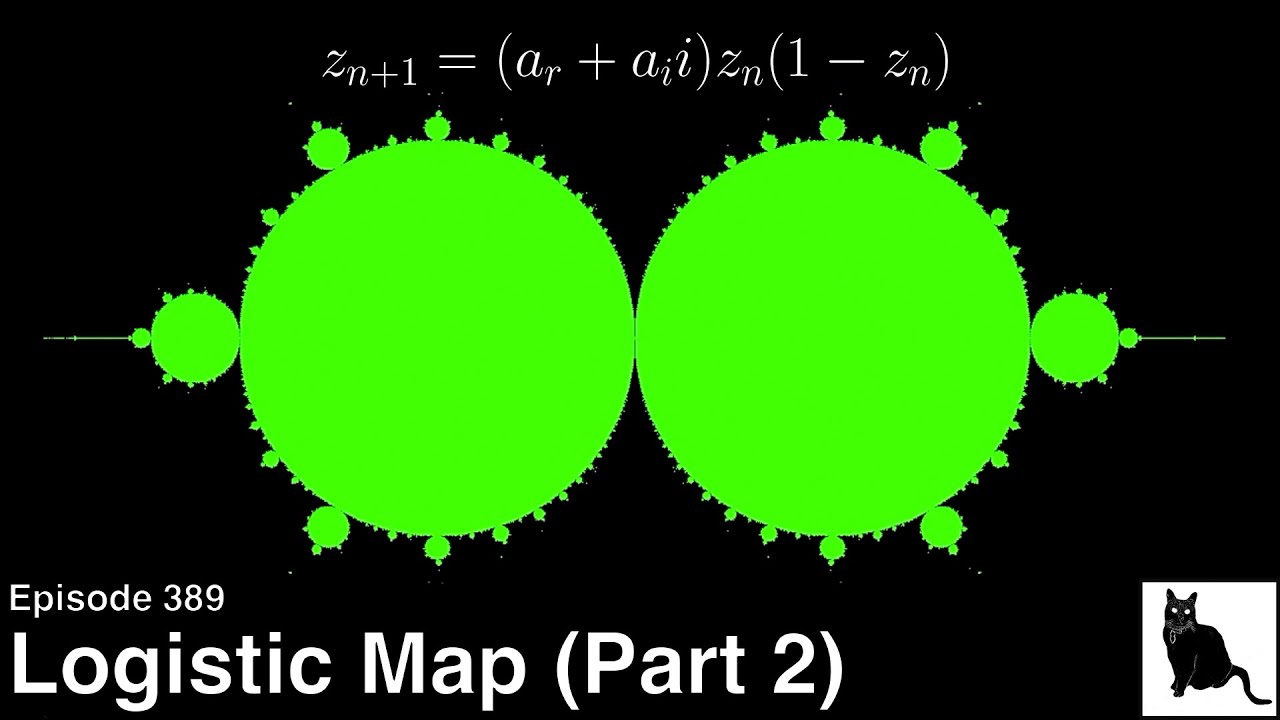
Logistic Map Part 2: Complex Numbers and 3D Bifurcation
Показать описание
We continue our exploration with of the logistic map by looking at its behavior with complex coefficients. In particular we focus on attractors, period double, and chaos as the emerge on the complex plane. If you have not already seen Part 1 of this series, we recommend checking that out first.
Chapters:
00:23 Recap
01:33 Programming the logistic map for complex numbers
02:55 Exploring the complex attractor plot of the logistic map
06:54 Setting up a 3D bifurcation plot
07:25. Exploring the 3D bifurcation plot
Background music by Amanda Chaudhary:
Fibonacci rhythmic patterns using Kiltratrick Audio Carbon Sequencer and Yamaha RX5 drum machine; processed using Qu-Bit Prism and Strymon StarLab reverb. Additional music via original patch made in Arturia Pigments.
Please subscribe to this channel for more mathematical and cultural content coming out regularly, and please consider supporting this channel so we may bring you more cultural content:
 0:09:44
Logistic Map Part 2: Complex Numbers and 3D Bifurcation
 0:15:19
Logistic Map, Part 2: Bifurcation Diagram and Self-Similarity
 0:18:39
This equation will change how you see the world (the logistic map)
 0:05:48
The Logistic Map: Attractors, Bifurcation, and Chaos (Part 1 of 2)
 0:18:55
The Feigenbaum Constant (4.669) - Numberphile
 0:06:14
Simple rules, complex result: Logistic map bifurcations
 0:09:46
Dynamical Systems And Chaos: Bifurcations: Part II (Logistic Map) Summary
 0:00:23
Logistic Map zoom at the boundary between order and chaos
 3:05:50
Online Refresher Course on AI & Machine Learning Mastery | CFDET IIT (BHU) Varanasi | 07 Dec 202...
 0:00:36
Logistic Map Superimposed upon its Bifurcation Diagram
 0:33:43
The (Discrete) Logistic Map for population modeling
 0:00:43
Introduction to Complexity: Logistic Map Quiz Solution
 0:20:35
Logistic Map, Part 3: Bifurcation Point Analysis | Bottlenecks in Maps, Intermittency Chaos
 0:00:41
Bifurcation diagram of the Logistic map.
 0:02:02
Presentation on The 1- and 2-Dimensional Logistic Maps
 0:39:13
Foundational Concepts In Chaos Theory: An Explanation of Veritasium's Logistic Map Video
 0:11:10
Introduction to Complexity: Logistic Map
 0:22:26
Existence of Period 2 Solutions to Discrete Logistic Map
 0:17:18
Logistic Map, Part 1: Period Doubling Route to Chaos
 0:01:12
The Sound of the Logistic Map
 0:00:30
Zoom into the bifurcation diagram for the logistic map (chaotic map)
 0:00:37
Logistic map bifurcation diagram
 0:00:37
Logistic map bifurcation diagram animation
 0:12:51
Chaos: The Science of the Butterfly Effect
Комментарии