filmov
tv
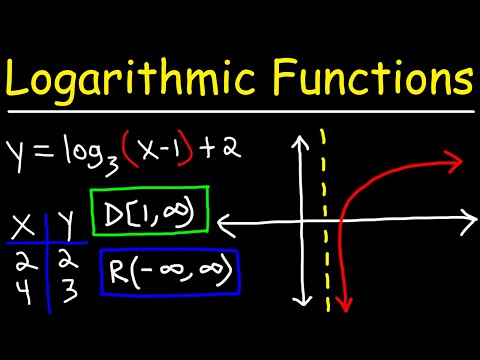
Graph a logarithmic function with multiple transformations

Показать описание
👉 Learn all about graphing logarithmic functions. A logarithmic function is a function with logarithms in them. The graph of the parent function of a logarithmic function usually takes its domain from the positive x-axis. To graph a logarithmic function, it is usually useful to first graph the parent function (without transformations). This can be done by choosing 2-3 points from the function and plotting them on the x-y coordinate axis to see the nature of the parent function's graph.
After graphing the parent function, we then apply the given transformations to obtain the required graph. When a constant is added to x in the function, the graph of the parent function shifts to the left by the same units as the constant added to x. Similarly, when a constant is subtracted from x in the function, the graph of the parent function shifts to the right by the same units as the constant subtracted from x.
When a constant is added to the function, the graph of the parent function shifts upwards by the same units as the constant added to the function. Similarly, when a constant is subtracted from the function, the graph of the parent function shifts downwards by the same units as the constant subtracted from the function.
Organized Videos:
✅How to Graph Logarithmic Functions
✅How to Graph Logarithmic Functions with Vertical Shift
✅How to Graph Logarithmic Functions in Different Bases
✅How to Graph Logarithmic Functions | Learn About
✅How to Graph Natuarl Logarithmic Functions with Transformations
✅How to Graph Logarithmic Functions with Horizontal Shift
✅How to Graph Logarithmic Functions with Transformations
Connect with me:
#logarithmicfunctions #brianmclogan
 0:12:03
Graphing Logarithmic Functions
 0:09:40
Graphing Logarithmic Functions with Transformations
 0:05:47
Learning to graph a logarithm step by step by applying transformations
 0:05:45
Graphing Natural logarithmic functions and Exponential Functions
 0:03:55
Graphing logarithmic equations
 0:09:10
Graphing logarithmic functions | Exponential and logarithmic functions | Algebra II | Khan Academy
 0:06:28
Graphs of logarithmic functions | Exponential and logarithmic functions | Algebra II | Khan Academy
 0:02:26
Graphing a logarithmic function: Basic
 0:04:09
How to use a table to graph logarithmic function
 0:19:00
Graphing Logarithmic functions the Smart way
 0:06:02
Ex: Graph an Exponential Function and Logarithmic Function
 0:11:12
Graphing Logarithmic Functions (1 of 2: Overview)
 0:05:06
Graphing logarithmic equations
 0:08:10
Logarithms Part 1: Evaluation of Logs and Graphing Logarithmic Functions
 0:02:27
Graphing a logarithmic function with transformations
 0:04:46
Graphing Log Functions by Hand: y=2log_(3)(x+1)-3
 0:18:00
Graphing Logarithms - Logs (2 Methods)
 0:03:19
Graph a logarithmic function with multiple transformations
 0:04:14
Learn to graph the logarithmic expression with multiple transformations
 0:03:29
Graphing logarithmic equations
 0:12:58
Graphing Logarithmic Functions | General Mathematics
 0:03:47
Logarithms - Graphing Exponential and Logarithmic Functions | Logs | Don't Memorise
 0:05:27
Graphing logarithmic functions (example 1) | Algebra 2 | Khan Academy
 0:01:08
Graphing a logarithmic function and identify the domain and range
Комментарии