filmov
tv
GrafanaCONline: Slicing Kubernetes: Raspberry Pis, monitoring and chaos

Показать описание
Do you ever feel like your systems lack unnecessary complexity and overengineering? This is the talk for you. Join me as I detail the creation of a Raspberry Pi-based desktop Kubernetes cluster in an attempt to overcomplicate the already complex world of stateless web application deployment. We’ll walk through building an observability platform using open source tools like Prometheus, Grafana, and Jaeger to keep a close watch on our tiny fragile microservices and then break them intentionally for our own amusement.
GrafanaCONline: Slicing Kubernetes: Raspberry Pis, monitoring and chaos
GrafanaCONline: Tanka: Declarative Dashboards for Declarative Clusters
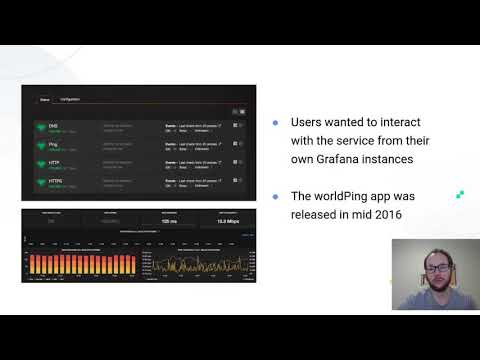
GrafanaCONline: worldPing
GrafanaCONline: Grafana 7.0
GrafanaCONline: Nissan Leaf → cloud all the things
Chris Bensen and the world's largest Raspberry Pi Supercluster
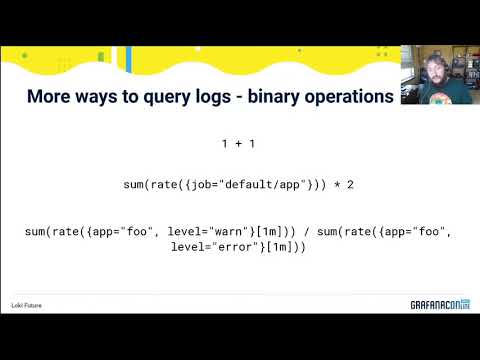
GrafanaCONline: Loki future
GrafanaCONline: What's new on Grafana Cloud Graphite and Metrictank
Ed Bennett – Developing and using a cluster of Raspberry Pis for outreach
GrafanaCONline: What's the bee-weather & how to correct particulate-matter readings
GrafanaCONline: How to get an organization to adopt a central telemetry solution
GrafanaCONline: The People and Business of Grafana Labs and Closing
GrafanaCONline: Fillet your herrings using Grafana
GrafanaCONline: Chrome browsing data to Grafana — as you browse
kubernetes monitoring with prometheus and grafana
HCICollector v0.7 beta Installation Walk Through
Docker Grafana 01 Intro
Observability with Prometheus and beyond: Leveraging cloud native technologies outside of cloud
GrafanaCONline: Grafana plugins
The Business of Grafana and Acquisition of Kausal
Importance Of Observability In The Cloud-Native World | Richard Hartmann - Grafana Labs
Grafana Project Update & What’s New in v6.0
Introduction to Alert Manager for Prometheus on Kubernetes
[ Kube 35.2 ] Deploying metrics server in Kubernetes without Helm
Комментарии
 0:57:14
 0:36:17
 0:48:36
 0:47:42
 0:50:07
 0:26:08
 0:48:32
 0:51:37
 0:39:21
 0:37:17
 0:21:55
 0:31:43
 0:16:11
 0:20:59
 0:39:38
 0:13:11
 0:11:09
 0:24:31
 1:23:50
 0:21:19
 0:26:48
 0:40:31
 0:13:37
 0:14:10