filmov
tv
Physics - Thermodynamics 2: Ch 32.1 Def. and Terms (14 of 25) The PVT Surface

Показать описание
In this video I will explain the PVT surface where pressure, volume, and temperature are graphed in a 3-D diagram.
Next video in this series can be seen at:
 0:04:07
Physics - Thermodynamics 2: Ch 32.1 Def. and Terms (22 of 25) PVT Surfaces for Real Substances
 0:03:24
Physics - Thermodynamics 2: Ch 32.1 Def. and Terms (24 of 25) Triple Point T and T
 0:07:01
Physics - Thermodynamics 2: Ch 32.1 Def. and Terms (23 of 25) PT Diagrams
 0:05:55
Physics - Thermodynamics 2: Ch 32.1 Def. and Terms (16 of 25) The van der Waals Constant
 0:06:11
Physics - Thermodynamics 2: Ch 32.1 Def. and Terms (4 of 23) State of a System
 0:04:23
Physics - Thermodynamics 2: Ch 32.1 Def. and Terms (10 of 23) Boyle's Law
 0:02:50
Physics - Thermodynamics 2: Ch 32.1 Def. and Terms (13 of 23) Avogadro's Law***
 0:04:31
Physics - Thermodynamics 2: Ch 32.1 Def. and Terms (2 of 25) Basic Terms and Properties
 0:00:00
Thermodynamics | One Shot 11th Class| Chemistry by Alok Sir #physicsbypankajsir #thermodynamics
 0:04:46
Physics - Thermodynamics 2: Ch 32.1 Def. and Terms (1 of 25) Basic Terms
 0:07:02
Physics - Thermodynamics 2: Ch 32.1 Def. and Terms (15 of 25) The van der Waals Equation
 0:03:33
Physics - Thermodynamics 2: Ch 32.1 Def. and Terms (8 of 23) The Ideal Gas Equation
 0:04:24
Physics - Thermodynamics 2: Ch 32.1 Def. and Terms (17 of 25) The van der Waals Eqn Interperted 1
 0:04:21
Physics - Thermodynamics 2: Ch 32.1 Def. and Terms (25 of 25) Critical Point Values
 0:03:56
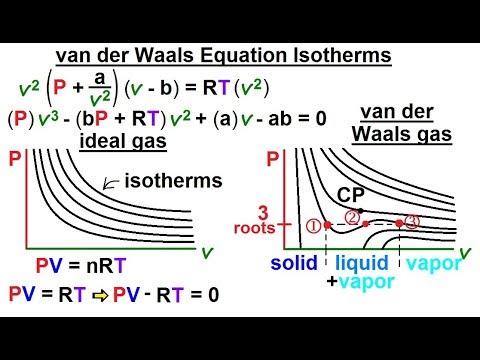
Physics - Thermodynamics 2: Ch 32.1 Def. and Terms (20 of 25) van der Waals Equation Isotherms
 0:03:44
Physics - Thermodynamics 2: Ch 32.1 Def. and Terms (5 of 23) Thermodynamic Precesses
 0:03:34
Physics - Thermodynamics 2: Ch 32.1 Def. and Terms (14 of 25) The PVT Surface
 0:04:06
Physics - Thermodynamics 2: Ch 32.1 Def. and Terms (9 of 23) What is the Gas Constant?
 0:03:15
Physics - Thermodynamics 2: Ch 32.1 Def. and Terms (6 of 23) Thermodynamic Unit (Pressure)
 0:05:34
Physics - Thermodynamics 2: Ch 32.1 Def. and Terms (21 of 25) van der Waals Eqn Isotherms Other Form
 0:03:35
Physics - Thermodynamics 2: Ch 32.1 Def. and Terms (3 of 23) Molecule Density and Quantity
 0:02:53
Physics - Thermodynamics 2: Ch 32.1 Def. and Terms (18 of 25) The van der Waals Eqn Interperted 2
 0:02:28
Physics - Thermodynamics 2: Ch 32.1 Def. and Terms (12 of 23) Charle's Law
 0:04:09
Physics - Thermodynamics 2: Ch 32.2 PVT Partial Derivatives (2 of 23) Keeping Pressure Constant
Комментарии