filmov
tv
Solve and graph 28-k≥7(k-4)

Показать описание
In this math video lesson on Multi-Step Inequalities, I solve 28-k greater than or equal to 7(k-4) and graph its solution. #multistepinequalities #inequalities #graphing #algebra
Every Month we have a new GIVEAWAY that is FREE to Enter. See link below for details. You can enter Every Month!
Visit our website for links to all of our videos:
Get Free Trials to Amazon Prime and others here:
Nominate a Great Teacher Here:
Have Math Lesson you would like to add to our community of videos? Click here:
Check out our Finance, Business and Life YouTube Channel:
Consider supporting us on Patreon...
Follow us for...
 0:03:34
Solve and graph 28-k≥7(k-4)
 0:03:40
Solve and graph 28-7x≤-4(-7x-7)
 0:02:10
Solve and graph k/4‹-4
 0:03:53
Solve and graph 6-4(6n+7)≥122
 0:03:06
Solve and graph -50‹7k+6‹-8
 0:03:27
Solve and graph 5(6+3r)+7≥127
 0:03:15
Solve and graph -6(1+7k)+7(1+6k)≤-2
 0:06:02
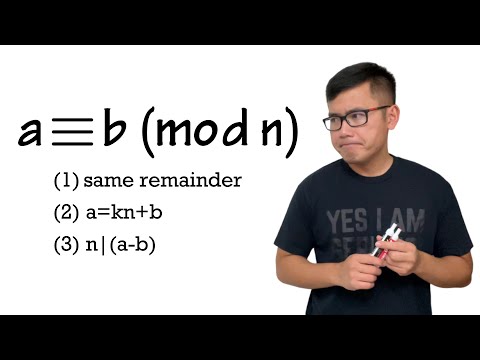
What does a ≡ b (mod n) mean? Basic Modular Arithmetic, Congruence
 0:18:51
0580/22/Feb/March/2024 | Paper 2 (Extended) | IGSCE Mathematics 0580
 0:03:10
Solve and graph 2n+7≥27 or 3+3n≤30
 0:03:44
How to Graph a circle
 0:06:46
Adding Integers | How to Add Positive and Negative Integers
 0:02:27
Grade 2 Math: Subtraction Rocks with Base Ten Blocks
 0:01:19
SAT Test 10: Graph of a quadratic - question #4-28
 0:04:51
Normal Distribution: Find Probabilities Given Z-scores Using Table (Left of Z-score)
 0:03:47
Solving an equation for y and x
 0:03:14
Solve and graph -36‹3p-6‹-15
 0:18:45
Direct and Inverse Proportion | Grade 7-9 Series | GCSE Maths Tutor
 0:05:06
How to find the center and radius of a circle in standard form
 0:06:47
First fit, Best fit, Worst fit dynamic memory allocation algorithm
 0:03:44
Percentiles - How to calculate Percentiles, Quartiles, ...
 0:08:13
Simple Bar Graph and Multiple Bar Graph using MS Excel (For Quantitative Data)
 0:39:55
EDEXCEL IAL PURE MATH 1 Straight line equation & graph CLASSIFIED PAST PAPERS
 0:03:43
Solve and graph 13+2v-8+6›-7-v
Комментарии