filmov
tv
Lesson 10: Frequency Response Analysis (Bode Plots)

Показать описание
Engineering students have traditionally used an oscilloscope and an external function generator to manually perform multiple amplitude and phase measurements at a range of frequencies to produce a frequency response plot to compare to a straight-line Bode plot approximation based on poles and zeros. This lessons shows how to perform gain and phase measurements on a L-C-R bandpass filter using the traditional method, as well how to perform the same measurement automatically using a scope with a built-in waveform generator and automatic frequency response analysis (Bode plots).
#oscilloscope #scope #measurement #measure #bodeplot #frequencyresponse #frequencyresponseanalysis #fra
#oscilloscope #scope #measurement #measure #bodeplot #frequencyresponse #frequencyresponseanalysis #fra
 0:11:11
Lesson 10: Frequency Response Analysis (Bode Plots)
 0:59:03
Frequency Response Analysis using Oscilloscopes
 0:36:49
Chapter 10: Frequency Response Part 1 - Sedra
 0:16:43
A quick introduction to frequency response
 0:08:08
Intro to Control - 14.1 Frequency Response
 0:49:49
CH10 Controller Design Frequency Response Method
 0:08:09
CBE 430 Week 10 01 Intro to Frequency Response
 0:03:30
Identify Frequencies In A Muddy Or Boomy Mix | Ear Training For Audio Engineers
 0:11:56
Chapter 18 Spatial Enhancement of Landsat 9 Imagery
 0:00:54
Frequency Function in Excel
 0:05:24
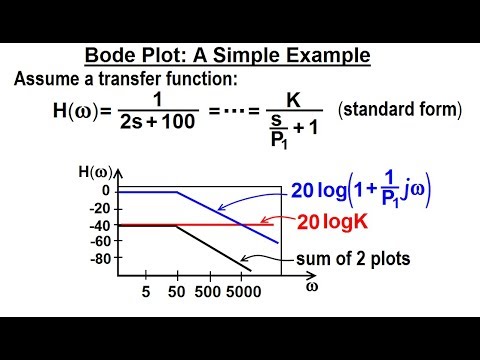
Electrical Engineering: Ch 15: Frequency Response (18 of 56) Bode Plot: A Simple Example
 0:06:20
Frequency Response Analysis Updates for InfiniiVision Oscilloscopes!
 0:29:47
What is frequency response analysis - FEA for All
 0:10:06
Frequency Response Analysis: Basics, Definition, Parameters, and Derivation
 0:10:49
What is Frequency Response Estimation?
 1:21:43
Lecture37 Frequency Response Analysis
 0:04:43
Frequency Response Analysis Part II - What frequency range do you need?
 0:02:05
Autodesk Nastran In-CAD Frequency Response
 1:30:31
Understanding Sweep Frequency Response Analysis and Best Field Practices
 0:06:08
Use Excel 2016 to make Frequency distribution and Histogram for quantitative data
 0:08:30
Simulating Frequency Response of an RC Circuit in LTspice
 0:04:02
Background Issues 4- Time-Frequency Analysis
 1:02:19
Frequency Response of Amplifier Lecture 10
 0:41:45
AIC Lecture 50) Frequency response analysis of an analog FIR filter amplifier problem
Комментарии