filmov
tv
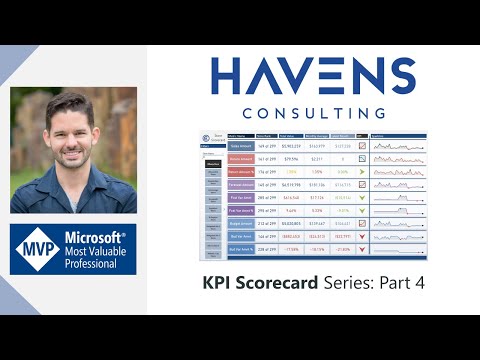
Creating A KPI Scorecard Report: Part 2

Показать описание
UPDATED TECHNIQUE 🌟
In this multi-part series you'll learn techniques utilizing DAX, custom visualizations, and design techniques to create a great looking KPI Scorecard report in Power BI.
Part Two will show you how to create KPI cards that utilize icons to as performance indicators, and how to create a sparkline. Both of these visuals will be imported from the custom visuals store as well.
VIDEO CHAPTERS 🎥
0:00 - Start of Video
0:12 - Content Intro
0:18 - Start of Demo
1:45 - Adding Custom Visual
3:30 - Creating DAX Measures
10:14 - Creating KPI Visual
11:24 - Creating Sparkline
Part 1 of this series can be found here:
Part 3 of the series can be found here:
Part 4 of the series can be found here:
Mat Allington's UNICHAR DAX Post:
LET'S CONNECT! 🧑🏽🤝🧑🏽 🌟
HAVENS CONSULTING PAGES 📄
EMAIL US AT 📧
#PowerBI #PBI #microsoftpowerbi #HavensConsulting #powerplatform #microsoft #businessintelligence #datascience #office #data #digitaltransformation #dataanalytics #tableau #excel #powerapps #datavisualization #dashboard #sharepoint #python #bi #analytics #cloud #azure #bigdata #sqlserver #software #sql #dynamics #dataanalysis #yammer #microsoftpowerbi #onedrive #machinelearning #bhfyp #powerbidesktop
 0:13:59
Creating A KPI Scorecard Report: Part 1
 0:07:56
Creating A KPI Scorecard Report: Part 3
 0:09:33
Power BI: Build a custom KPI scorecard
 0:11:34
Creating A KPI Scorecard Report: Part 4
 0:20:29
Microsoft Power BI Metrics & Scorecards demo
 0:14:47
Creating A KPI Scorecard Report: Part 2
 0:13:08
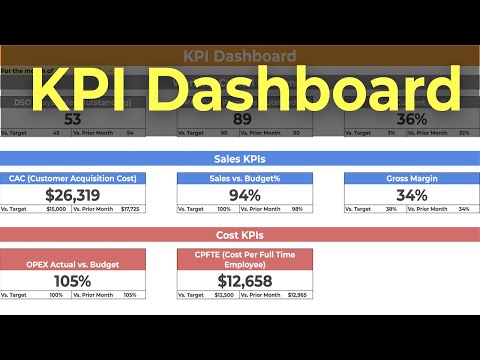
How To Create a KPI Dashboard in 10 Minutes!
 0:00:23
Excel KPI Dashboard Template
 0:02:23
How To Create a KPI Dashboard In Excel? [2022]
 0:06:45
Create a custom KPI Card in a Power BI report
 0:04:50
How to create a KPI Scorecard you will love
 0:02:30
How To Create a KPI visual in Power BI
 0:59:51
Building a KPI Scorecard w/ Custom Visuals in Power BI with Reid Havens
 0:13:37
KPI Visual Ideas in Power BI
 0:27:13
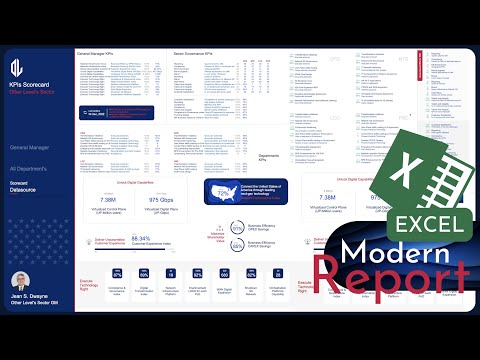
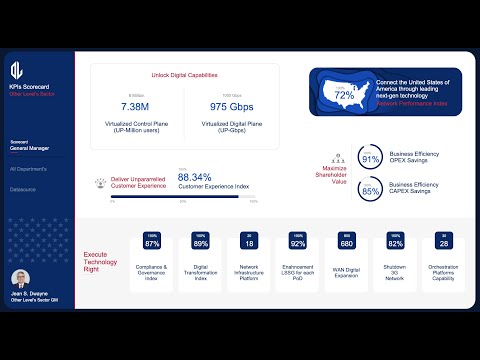
Advanced & Modern Excel Report - KPIs Scorecard | Tutorial 1
 0:09:32
KPI Scorecard Chart in Excel - Fully Customizable
 0:35:58
KPIs Scorecard Excel Report
 0:05:25
BMC Remedy Smart Reporting - Creating KPI scorecards - Part 1 of 2
 0:05:51
Generate dynamic reports and create smoother workflows with Passport’s 360 KPI Scorecard
 0:12:42
How To develop great KPIs (Key Performance Indicators) for your business, department or project
 0:18:43
Show QUICK KPI Progress using METRICS in Power BI // Walkthrough of Goals/Metrics and New Features
 0:05:40
How to Develop Key Performance Indicators
 0:26:34
Mini-Course Pt1 - How to Use Power BI Metrics to Quickly Create a Maintenance KPI Balanced Scorecard
 0:19:21
📊 How to Build Excel Interactive Dashboards
Комментарии