filmov
tv
Debugging with stack traces | Intro to CS - Python | Khan Academy

Показать описание
Code along with a software engineer in this debugging worked example using error messages. How can I figure out what's causing the error in my program? Learn how to interpret stack traces and linter messages to debug syntax errors, runtime errors, and logic errors.
Courses on Khan Academy are always 100% free. Start practicing—and saving your progress—now with our Intro to Computer Science - Python course!
Khan Academy is a nonprofit organization with the mission of providing a free, world-class education for anyone, anywhere. We offer quizzes, questions, instructional videos, and articles on a range of academic subjects, including math, biology, chemistry, physics, history, economics, finance, grammar, preschool learning, and more. We provide teachers with tools and data so they can help their students develop the skills, habits, and mindsets for success in school and beyond. Khan Academy has been translated into dozens of languages, and 15 million people around the globe learn on Khan Academy every month. As a 501(c)(3) nonprofit organization, we would love your help!
TIMESTAMPS:
00:00 - 00:14 : what is debugging?
00:15 - 02:15 : unterminated string literal
02:16 - 03:05 : commenting out a line
03:06 - 03:30 : indentation error
03:31 - 04:25 : runtime error
04:26 - 05:49 : checking for logic errors
 0:05:50
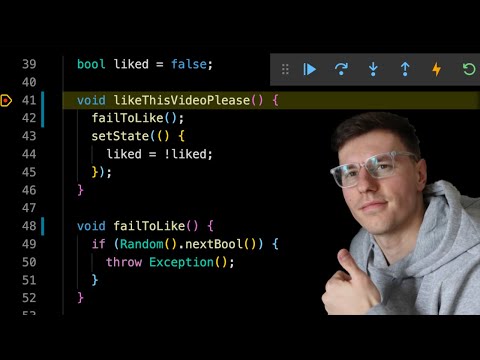
Debugging with stack traces | Intro to CS - Python | Khan Academy
 0:08:40
Easy Debugging with Breakpoints and Stack Trace
 0:02:10
What is a stack trace, and how can I use it to debug my application errors?
 0:09:58
Fortran Debugging -- Stack Traces
 0:16:58
The Stack Trace and Debugging
 0:25:58
Debugging PySpark -- Or trying to make sense of a JVM stack trace when you were minding your own bus
 0:03:37
How to read a stack trace in VS Code to debug a Node.js app [25 of 26] | Node.js for Beginners
 0:01:00
Angular 15 Debugging Stack Trace
 0:09:26
This IMMEDIATELY Changes How We Debug Fullstack Applications!
 0:13:27
Debugging Ruby: How to Interpret a Stacktrace
 0:09:19
CS 124 Fall 2022: MP Debugging Java Part 3: Reading Stack Traces
 0:06:13
What is a stacktrace?
 0:01:39
Debugging Made Easy: Fix Bugs Faster with Stack Traces & AI | Qodo
 1:04:40
Coding tips for beginners | docs, error debugging, stack trace and more | Quick programming tutorial
 0:05:15
Understanding Java Stack Traces: An Overview | Advance Java Course | Whizlabs
 1:14:39
Reliable Stack Traces, the Reality of Myth
 0:06:08
Mastering Debugging: A Deep Dive into the Call Stack in Java
 0:02:55
Stack Trace or Thread Dump
 0:40:00
Holden Karau | Debugging PySpark - Pretending to make sense of JVM stack traces
 0:14:31
Why: Python Debugging, Stack Trace, Exception Handling, Try / Except & Raise? (W/ Mnemonics)
 0:06:20
How to read Java stack traces efficiently - Tips & Tricks #006 | Vlogs
 0:09:41
Better Exception stack traces in .NET with Ben.Demystifier
 0:06:36
1 Debugging + Stack Traces in PHP + Overview
 0:03:14
How to Read a Stacktrace in Java
Комментарии