filmov
tv
6A Introduction to Bivariate Scatterplots (1 of 2)

Показать описание
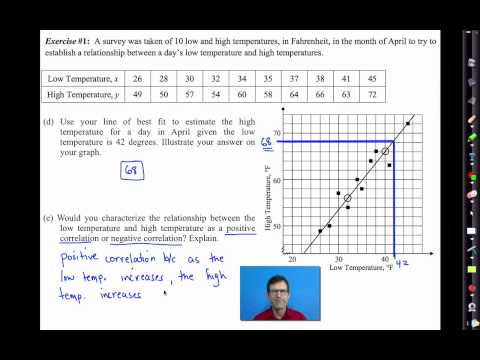
Introduces bivariate scatterplots. Completes an example, describing the correlation between a person's height and arm span.
The following video is linked to a theory work booklet. This book is to help students studying for the year 12 HSC NSW Standard Mathematics 2 course. The link to the PDF booklet is below:
It is recommended that you complete questions from the Cambridge Year 12 Mathematics Standard 2 Textbook.
The following video is linked to a theory work booklet. This book is to help students studying for the year 12 HSC NSW Standard Mathematics 2 course. The link to the PDF booklet is below:
It is recommended that you complete questions from the Cambridge Year 12 Mathematics Standard 2 Textbook.
 0:05:46
6A Introduction to Bivariate Scatterplots (1 of 2)
 0:04:47
6A Introduction to Bivariate Scatterplots (2 of 2)
 0:04:51
Scatter Plots, Association and Correlation
 0:03:31
Scatter Graphs: Correlation
 0:15:23
Using a bivariate scatterplot
 0:08:12
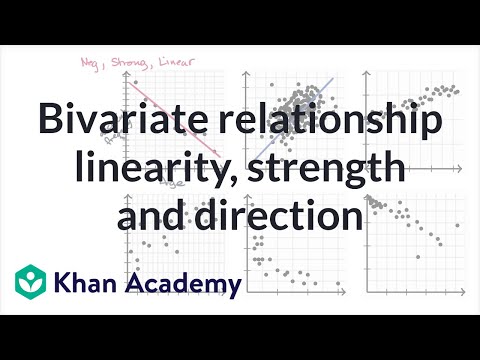
Bivariate relationship linearity, strength and direction | AP Statistics | Khan Academy
 0:19:14
Bivariate Data and Scatterplots
 0:10:37
Bivariate Statistics [IB Math AA SL/HL]
 0:08:10
Scatter Plots and Bivariate Data
 0:08:34
Introduction to Bivariate Data (1 of 2: Dependent & independent variables)
 0:08:14
Features of Bivariate Data: Constructing Scatterplots
 0:18:03
Bivariate Data - General Math Tutorial - External Exam Prep
 0:09:45
Bivariate Data and Scatterplots
 0:06:03
Statistics - Making a scatter plot
 0:00:38
Scatterplots on the SAT
 0:00:09
Scatter Plots & Correlation 📉#shorts #ytshorts #correlation #scatterdiagram #graoh #short #trend...
 0:00:39
What is the XY Scatter Plot | #Statistics #LeanSixSigma #OpEx #SixSigma #ASQGreenBelt #CSSGB
 0:09:16
Constructing Bivariate Scatterplots
 0:06:40
6B Bivariate Data Relationships (1 of 4)
 0:21:12
Common Core Algebra I.Unit #10.Lesson #6.Bivariate Data Analysis
 0:13:48
Introduction to Bivariate data analysis
 0:52:50
ILLUSTRATING BIVARIATE DATA AND CONSTRUCTING A SCATTERPLOT | Module 6 - Quarter 4 / Prob & Stat
 0:07:16
Bivariate Data/Scatter Plots
 0:23:22
Bivariate Data, Scatter Plots and Correlation
Комментарии