filmov
tv
Build Dynamic Pie Charts with Slicers for Powerful Data Visualization in Excel

Показать описание
Build Dynamic Pie Charts & Filter with Slicers in Excel! (Easy Guide)
Unlock hidden insights from your data with interactive pie charts and powerful slicers in Excel.
This simple guide shows you how to:
1️⃣ Create stunning pie charts that update instantly.
2️⃣ Add slicers to filter your data with ease.
3️⃣ Gain deeper understanding of your information.
No complicated formulas needed!
Perfect for:
Business professionals
Students
Anyone who wants to visualize their data effectively
Get started today and transform your spreadsheets!
===CHAPTERS===
0:00 Introduction to Excel's Pie Chart Wizard
0:30 Exploring Interactive Insights with Slicers
1:14 Hands-on Tutorial: Building Dynamic Pie Charts
3:04 Formatting Chart
4:33 Applying Data Label
I hope you learn somethings Useful please Subscribe my channel for more videos :)
 0:06:55
Build Dynamic Pie Charts with Slicers for Powerful Data Visualization in Excel
 0:05:06
How-to Make a Dynamic Excel Pie Chart with 4 steps in less than 4 minutes
 0:07:32
Create Dynamic Pie Charts in Adobe Illustrator
 0:02:46
Dynamic Pie Char - | Practical examples | Chart 4
 0:05:12
How to make a dynamic pie chart in PHP in 2 steps | 100% working source code
 0:05:02
Create dynamic Pie chart in Power BI | Dynamic TOP N Slicer Selection
 0:10:15
Effortlessly Create Dynamic Charts in Excel: New Feature Alert!
 0:00:55
Create Dynamic Pie Chart with Slicer in Excel #exceltips #exceltutorial #shorts
 0:09:21
How to create a Gear Pie Chart
 0:02:55
HOW TO | Create a Pie Graph with Pie Graph Explosion in Excel
 0:00:28
How to make a pie chart in Google Sheets! 🥧 #googlesheets #spreadsheet #excel #exceltips
 0:07:51
Data Visualization Power Move: Nested Pie Charts in Excel
 0:10:31
Progress Circle Chart in Excel as NEVER seen before!
 0:00:51
Fun PIE CHARTS in PowerPoint #Powerpoint #tutorial
 0:05:45
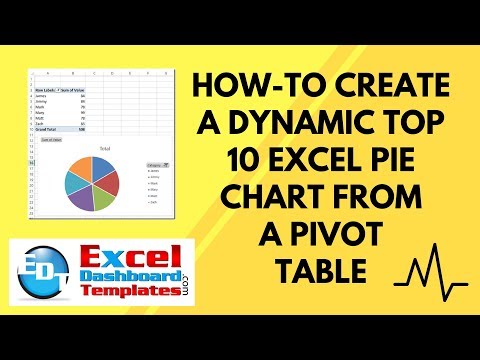
How-to Create a Dynamic Top 10 Excel Pie Chart from a Pivot Table
 0:08:09
Excel Dynamic Chart with Drop down List (column graph with average line)
 0:14:05
Creating Dynamic Pie/Donut Charts in SwiftUI from Data: A Step-by-Step Guide
 0:20:46
How to Build Dynamic Pie Chart in Excel
 0:19:11
Doughnut Pie Chart in Excel - Infographic
 0:00:33
How to create a pie chart using multiple measures in Tableau
 0:11:21
9 Make dynamic pie chart
 0:08:33
Laravel 10 Create Dynamic Pie Chart with Google Chart js Example
 0:06:22
Create a Dynamic Pie Chart In Power BI | Top N Slicer Selection 2024 | Power BI Tutorial
 0:00:24
Excel Charts: Pie Chart --- Changes Month wise using dropdown
Комментарии