filmov
tv
R Tutorial: Distance metrics

Показать описание
---
Welcome to the second video of the course. In this lesson, we will learn about why we need distance metrics, what a distance metric is exactly, and which types of distance metrics are available.
The similarity between MNIST digits can be quantified using a distance metric.
A metric is a function that for any given points, the output satisfies the following properties.
First, the triangle inequality, which means that the distance between two vectors is the shortest distance along any path. Second, the symmetric property, that is the distance between x and y is the same in either direction, and third, the distance is positive between two different vectors and is zero from a vector to itself.
In a two dimensional space, the Euclidean distance between two points p and q is the length of the line segment connecting them.
In this example, you can see how we compute the Euclidean distance between the points p and q.
Euclidean distance can be also generalized to high dimensional vectors.
You can use the function dist() to compute the Euclidean distance matrix between the rows of a data matrix.
Let's see how we compute the Euclidean distance of the last six digits in mnist_sample.
In the object distances, you can see the computed values.
Now, we will plot those values using a heatmap with each digit label.
The first and third examples of digit eight are the most similar regarding this metric because the color is darker, but that does not happen for the other digits with label eight.
Minkowski provided a generalization for the Euclidean distance.
Each name for the Minkowski distance arises from the order p of the general formula that you are seeing here. When p is equal to 1 we call it the Manhattan distance, when p is equal to 2 the Euclidean distance and when p is equal to infinite it is known as the Chebyshev distance.
In R, we can compute these metrics using the dist() function. This code shows how we compute the Minkowski distance of the order three.
The Manhattan distance computes the distance that would be traveled to get from one data point to another if a grid-like path is followed.
The Kullback-Leibler divergence or KL divergence is a measure of how one probability distribution is different from a second one.
It is not a strict metric since it does not satisfy the symmetric and triangle inequality properties.
A divergence of 0 indicates that the two distributions are identical.
It is a common distance metric used to optimize algorithms in Machine Learning, like in the case of t-SNE. In decision trees, for example, it is called Information Gain.
To compute the KL divergence in R we are going to use the philentropy package. First, we load the package and store the last 6 MNIST records from mnist_sample without getting the true label.
To compute the KL divergence all values need to sum up to one. So we are going to normalize the pixel values of each digit. First, we add 1 to all records to avoid getting a NaN while rescaling. Then we get the rowSums() of each record.
Finally, we will compute the KL divergence using the distance() function and generate the corresponding heatmap.
As you can see we are doing a much better job of finding the similarities between digits. Here all the positions that correspond to the digit eight are the most similar ones.
Now, it's time to practice with the MNIST dataset and compute some similarity or distance metrics to identify similar digits.
#R #RTutorial #DataCamp #Advanced #Dimensionality #Reduction #Distance #metrics
 0:04:41
R Tutorial: Distance metrics
 0:03:20
R Tutorial: Distance between two observations
 0:03:45
dist Function in R (4 Examples) | Compute Euclidean & Manhattan Distance | Diagonal & Upper ...
 0:12:22
Hierarchical Clustering With R - Part 1 (Introduction and Distance Measures)
 0:04:08
R Tutorial: Measuring distance for categorical data
 0:09:53
ML 20 : Distance Metrics Models | Euclidean | Manhattan | Minkowski | Hamming Distance with Examples
 0:27:35
Measuring Similarity of Data - Distance Metrics
 0:20:12
Understanding Hierarchical Clustering in R Distance Measures and Linkage Methods 📊
 0:23:42
How to use R to create a heatmap from a distance matrix with ggplot2 (CC209)
 0:08:39
Euclidean Distance and Manhattan Distance
 2:19:07
R Basics, Distance Measures, Principal Component Analysis, and Non-Metric Multidimensional Scaling
 0:01:19
What is the Distance Matrix API?
 0:04:27
Rule of Thumb - Distance ( EASY !!! ). No Math Needed
 0:14:03
Cosine Similarity using R - Comparison with Euclidean Distance
 0:06:10
Distance Matrix Methods, part 1
 0:05:39
recommender system using R (Basic Concepts): Part 1 Euclidean Distance
 0:20:55
12.1. Distance-based Multivariate Methods (mv690, distance)
 0:04:54
Using small subset to understand euclidean distance measure
 0:05:53
Euclidean Distance simply explained with examples | Science in Data
 0:11:02
Distance Metric Learning On The L1000 Connectivity Map
 0:11:23
amv50 - Distance Matrix Used in Cluster Analyses
 0:01:11
R : Euclidean distance in R using two variables in a matrix
 0:03:29
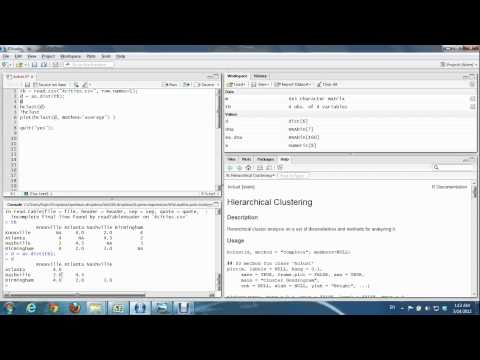
Hierarchical Clustering by hclust in R on a distance matrix between four cities
 0:04:51
Euclidean Distance & Cosine Similarity | Introduction to Data Mining part 18
Комментарии