filmov
tv
Power BI: Displaying Live System Performance using Power BI, SQL and Python

Показать описание
The video explains a step-by-step guide on how to display system performance information in real-time using Python, Microsoft SQL Server, and Power BI Desktop. The narrator explains that this exercise will help learners understand Python, SQL, and Power BI Desktop and how to connect the three major data science applications.
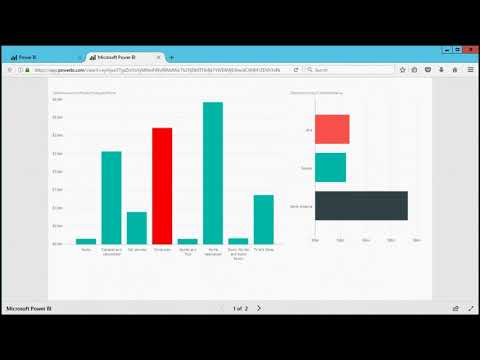
The video begins by explaining that Python will be used to read system performance information, which will then be inserted into Microsoft SQL Server Database. Afterward, Microsoft Power BI Desktop will be used to display the information on a dashboard in real-time, just like in Windows Task Manager.
The video then shows how to create a new database in Microsoft SQL Server and name it "system information." The narrator explains that they will create a new table in this database named "performance" and shows how to add various columns to store CPU usage information, memory usage information, CPU interrupts, CPU calls, memory used, memory free, bytes sent over the Internet, bytes received from the Internet, and disk usage information.
After creating the table, the video shows that it is currently blank, and no data has been entered yet. The next chapter will explain how to insert data into the table using Python.
The video then goes on to explain how to import Python system and process utilities, the time library, and the ODBC library for Python. After importing the libraries, the narrator shows how to create a connection to the SQL Server database using the ODBC Python library. They also explain how to find out the server name from the SQL Server Management Studio and enter it in the Python script.
Next, the video shows how to create a SQL cursor using the connection defined above. The narrator then creates an infinite loop using Python's system utility and explains how to gather system performance information using the Python script. They also explain how to insert the gathered information into the Microsoft SQL Server database using the SQL cursor.
Overall, the video provides a detailed explanation of how to display system performance information in real-time using Python, Microsoft SQL Server, and Power BI Desktop. It covers all the necessary steps from creating a new database to inserting data into the database using Python.
Chapters:
00:55 - Designing SQL Database
04:22 - Using Python to Get System Performance
14:33 - Testing the Application
15:14 - Connecting Power BI to SQL Server
25:49 - Creating Measures for Latest Values
18:20 - Creating Power BI Live Dashboard
24:12 - Testing the Final Results
#Python #SQLServer #PowerBI #RealTimeDashboard #SystemPerformance #DataScience #ODBC #DatabaseManagement #DataVisualization #Microsoft #WindowsTaskManager #PerformanceMonitoring
 0:25:50
Power BI: Displaying Live System Performance using Power BI, SQL and Python
 0:09:46
Power BI: Displaying Realtime information in Power BI Dashboard using SQL Server
 0:04:01
Microsoft Power BI | How to get LIVE data from Website? | Tutorialspoint
 0:20:43
Power BI: Displaying Realtime Boiler Plant Information in Power BI Dashboard using SQL Server
 0:08:31
Power BI Get Data: Import vs. DirectQuery vs. Live (2021)
 0:05:03
The MAGIC of Microsoft Teams + Power BI
 0:20:51
Creating REAL TIME analysis in Power BI! LIVE vehicle tracking with Azure Stream Analytics #Powerbi
 0:02:38
Microsoft Power BI | How to get data from SQL server? | Tutorialspoint
![[Live Day 2]](https://i.ytimg.com/vi/rDBIj5ETRhA/hqdefault.jpg) 0:37:53
0:37:53
[Live Day 2] Free Linux Session | Linux for beginner | Ankush Sir | Learnomate Technologies
 0:07:51
Different ways to work with Microsoft Excel in Power BI (2023)
 0:15:10
How to create Power BI Dashboard (Report) in 7 Minutes in Power BI Desktop | @PavanLalwani
 0:10:17
FINALLY! Properly Present Your Power BI Dashboard in PowerPoint (keep the interactivity)
 0:41:07
How to Build Power BI Reports from Start to Finish
 0:01:10
How to publish power bi report to web
 0:07:20
How to Connect Power BI to SharePoint Excel | Connect & Sync Excel Online to Power BI
 0:02:30
How To Create a KPI visual in Power BI
 0:13:27
Powerbi build realtime streaming dashboard with SQL Server
 0:04:30
Refresh and NO DATA in my Power BI visuals???
 0:03:20
Live SQL Databases to Practice Power BI
 0:07:07
Report level measures with Power BI live connections
 0:15:32
Power BI: Complete Realtime Dashboard Demo using SQL Server Database from start to end
 0:02:44
Quickly create reports from SharePoint lists
 0:04:18
Embedding Power BI Reports in Web Pages
 0:08:09
Why is my Power BI refresh so SLOW?!? 3 Bottlenecks for refresh performance
Комментарии