filmov
tv
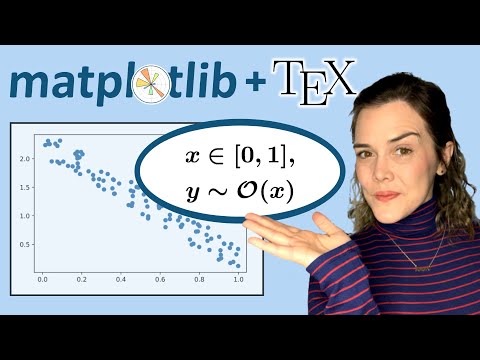
Add math symbols to matplotlib figures with matplotlib LaTeX || Matplotlib Tips

Показать описание
Use matplotlib latex to show equations on a matplotlib figure. I demonstrate how to add symbols to the matplotlib title, annotations, legends, and axes labels. First I explain how to make matplotlib subscripts and superscripts with TeX as well as matplotlib Greek letters. Then I demo how to write matplotlib latex fractions and full equations on matplotlib. I also mention additional ways to use TeX with matplotlib to create accent marks, equation arrays, and additional font styles to write Big O notation, for example.
0:00 Introduction
0:36 Subscripts & Greek Letters
3:20 Fractions & Equations
4:52 More with TeX
5:19 Conclusion
Matplotlib Resource - List of TeX Symbols:
Github Code:
Related Videos:
#matplotlib #dataviz #matplotlibtips
0:00 Introduction
0:36 Subscripts & Greek Letters
3:20 Fractions & Equations
4:52 More with TeX
5:19 Conclusion
Matplotlib Resource - List of TeX Symbols:
Github Code:
Related Videos:
#matplotlib #dataviz #matplotlibtips
 0:05:42
Add math symbols to matplotlib figures with matplotlib LaTeX || Matplotlib Tips
 0:22:19
Latex | How to write Math expression in Python plot | Title|Label| Text| Annotate| for Beginner
 0:07:22
MetPy Mondays #40 - LaTeX in Matplotlib
 0:11:25
Render Math Formulas From LaTeX in Python
 0:03:28
Python Matplotlib Tutorial - How to Create Symbolic Titles with Latex
 0:07:00
How to add PATTERNS to matplotlib figures || Matplotlib hatch color and linewidth || Matplotlib Tips
 0:09:26
handcalcs - Automatically render LATEX equations from Python Math Code
 0:06:54
How to Add Annotations to Matplotlib Charts
 0:06:55
How to add shading to matplotlib figures and fill between two lines || Matplotlib Tips
 0:03:22
matplotlib Part 5 – Adding Axes to the Figure
 0:04:16
Add a baseline to a matplotlib figure || Horizontal and vertical lines || Matplotlib Tips
 0:00:40
How to type greek letters and symbols in Python
 0:00:15
Cosplay by b.tech final year at IIT Kharagpur
 0:08:36
Matplotlib currency label formatting guide
 0:00:56
PYTHON PLOTTING SYMPY MATPLOTLIB SCATTER PLOT | SYMBOLIC PYTHON| #coding #short #trending #viral
 0:01:05
Mathematical Symbols In Python
 0:03:56
Mathematical symbols in Jupyter notebook
 0:15:09
Creating Quality Plots For Publication: Python, Overleaf, PowerPoint
 0:00:55
Programming Language Tier List
 0:09:49
Solving Equations Symbolically And Using LaTeX In Python!
 0:11:05
Add TEXT to MATPLOTLIB figures || Python matplotlib text with plt.text() || Matplotlib Tips
 0:03:10
Basic graph manipulations using matplotlib
 0:00:11
🧮 Effortlessly Display Complex Math Formulas in Jupyter Notebook with Python #shorts
 0:01:04
Python Matplot library & Latex to Image conversion
Комментарии