filmov
tv
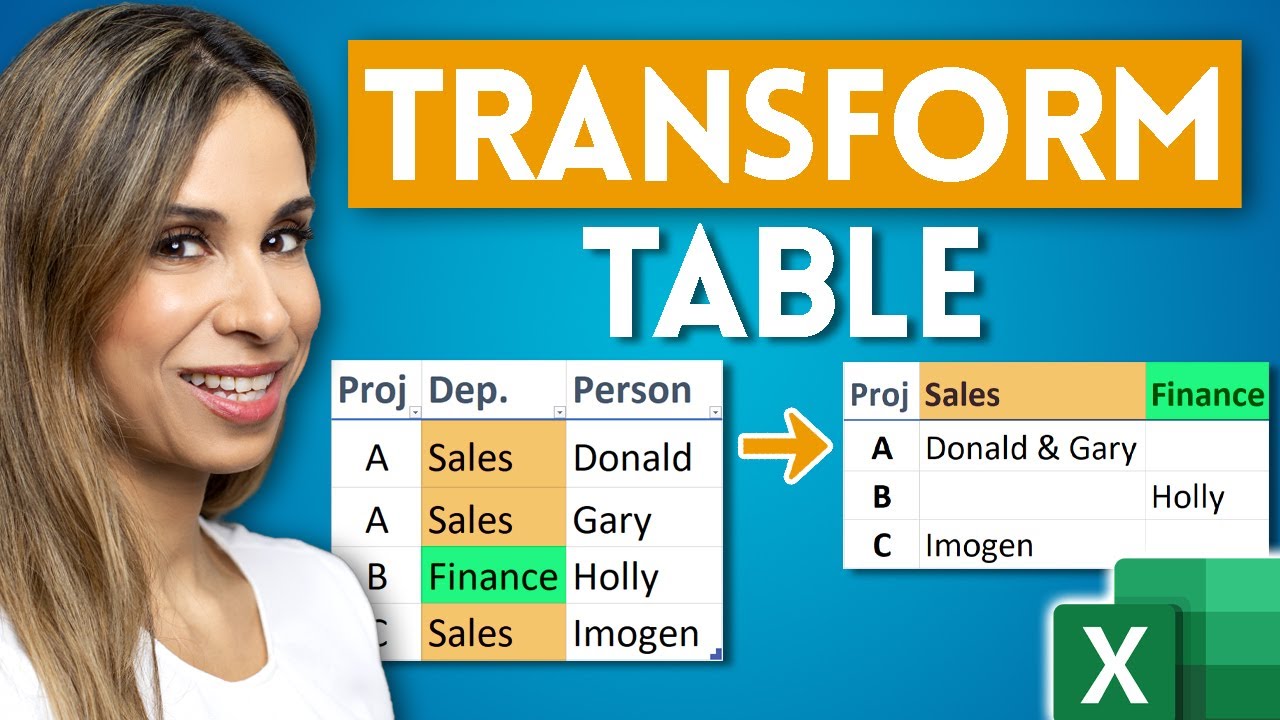
3 Ways to Switch Data in Columns to Rows in Excel (Multiple Values)
Показать описание
In this video you'll learn how to switch data in columns to rows. Pivoting columns in Excel is a common problem when cleaning and organizing data. In this case however, we have a more complex scenario where we have multiple values when pivoting data. We'll have to combine these multiple values into one cell. I'll show you 3 methods to get this done. We'll use Dynamic array Formulas, Power Query (Pivot columns with multiple records) and finally Power Pivot and DAX (CONCATENEX together with HASONEFILTER).
We'll tackle a common data organization challenge in Excel—converting data in columns into rows. The scenario involves multiple departments working on various projects, with the goal of presenting this information in a dynamic and structured way.
Key Steps Covered:
Using Formulas: We start by utilizing Excel formulas, such as UNIQUE and FILTER, to extract unique values and handle cases where multiple people from the same department work on the same project.
Power Query: We explore the Power Query approach, demonstrating how to pivot columns and handle cases with multiple values in a cell.
Power Pivot and DAX: For more advanced users, we dive into Power Pivot and DAX to create a measure that dynamically concatenates values based on project and department, providing a highly flexible solution.
00:00 Transform Data in Tables from Columns to Rows
01:10 How to Use Formulas to Switch Data from Columns to Rows
05:51 How to Use Power Query to Pivot Columns with Multiple values
10:27 How to Use Power Pivot and DAX to create a measure with multiple values
16:33 Wrap Up
🚩Let’s connect on social:
Note: This description contains affiliate links, which means at no additional cost to you, we will receive a small commission if you make a purchase using the links. This helps support the channel and allows us to continue to make videos like this. Thank you for your support!
#excel
 0:17:08
3 Ways to Switch Data in Columns to Rows in Excel (Multiple Values)
 0:08:42
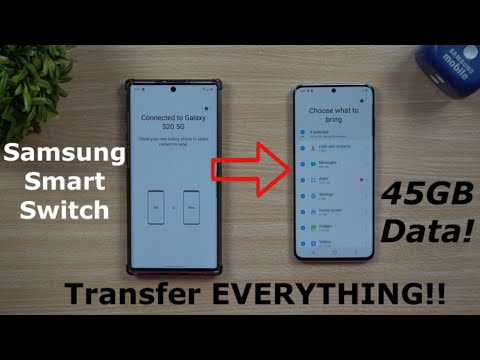
Samsung Smart Switch | 3 Ways To Transfer Data to New Phone
 0:10:14
3 Ways To Switch Or Rotate Data From Vertical To Horizontal
 0:07:43
3 ways you can switch to a data science career from non technical background
 0:04:48
How to transfer User data to a new Nintendo Switch OLED
 0:08:25
How to Transfer Data From OLD Samsung to NEW Samsung (Smart Switch)
 0:07:57
How to Switch to Android and Keep Your Data
 0:07:15
Samsung Smart Switch 2020 - Transfer ALL Your Data, FAST!
 0:32:27
How Much AI Do We Really Need: A Conversation with Siddharth Pai & Nitin Seth | The Core
 0:00:42
Switch Mobile Data in Seconds with iPhone Shortcuts!
 0:03:38
How to Transfer Nintendo Switch SD Card Data to a New SD Card
 0:01:30
Galaxy S23's: How to Switch Mobile Data to SIM 1/SIM 2/Off
 0:01:43
[iPhone to Note 5]: How to Switch All Data from iPhone to Samsung Galaxy Note 5
 0:00:47
Tutorial: Reset, Restart, and Delete Save Data on Nintendo Switch (Pokemon Let's Go)♀ Eevee/Pik...
 0:23:20
2 Best Ways to Transfer Data Using Samsung Smart Switch (2020)
 0:00:14
Switch data(internet) between two SIM (SIM1 to SIM2 or SIM2 to SIM1) [Realme ] Realme narzo 30 4g
 0:02:27
Nintendo Switch: How to Back Up Save Data to Cloud
 0:05:43
Guide To Owning Multiple Switch's in 2022 (Easy Save Data Transfer)
 0:08:16
Samsung Smart Switch 2021 - Transfer ALL Your Data. FAST!
 0:01:14
How to Switch All Data from Android Phone to Google Pixel 3 (XL)
 0:01:14
How to Switch All Data from OnePlus Phone to Google Pixel 3 (XL)
 0:04:10
NEW Nintendo Switch Save Data Transfer Tutorial
 0:02:02
HOW TO SWITCH DATA BY USING THE TRANSPOSE FUNCTION IN EXCEL
 0:01:00
How Easy/Hard Is It to Switch to a Data Analytics Career?
Комментарии