filmov
tv
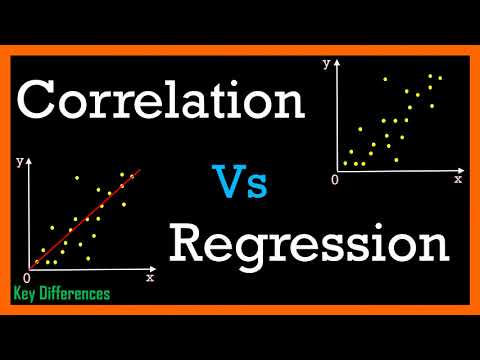
Scatter Diagrams, Correlation, and Regression in Excel 2016

Показать описание
This video shows you how to create a scatter diagram to examine the relationship between two numeric variables, how to test the significance of a correlation, and how to create a regression equation and regression line in a scatter diagram.
 0:04:51
 0:04:52
 0:07:59
 0:07:51
 0:03:31
 0:03:24
 0:23:56
 0:03:36
 0:06:52
 0:04:18
 0:03:37
 0:06:56
 0:28:54
 0:00:54
 0:08:12
 0:00:39
 0:02:04
 0:02:59
 0:19:06
 0:06:03
 0:07:50
 0:12:57
 0:07:11
 0:08:38