filmov
tv
Excel Statistical Analysis 05: Frequency Distributions & Visualizations for Categorical Data

Показать описание
Learn about creating Frequency Distributions & Column and Bar Chart Visualizations for Categorical Data. See an Epic Summary of EVERYTHING you need to know about Column and Bar Charts.
Topics:
1. (00:00)
2. (00:22) Download Excel
3. (00:39) Descriptive Statistics: Tabular (Reports) and Graphical (Visualizations)
4. (01:43) What type of tabular and graphical summaries based on one variable or two variable
5. (03:00) Cheat Sheet with Terms for chapter
6. (03:16) Epic Summary for when and how to use Column and Bar Charts
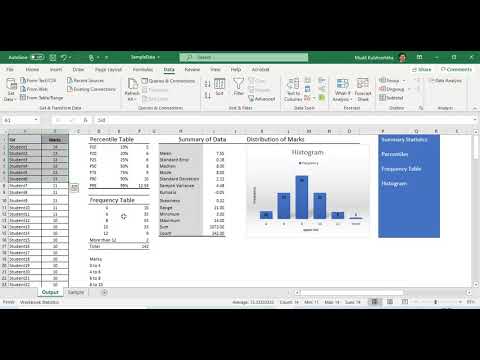
7. (07:32) PivotTable to create Frequency Distribution for Categorical Variable “Payment Method”. See three calculations: Frequency, % Frequency, Relative Frequency
8. (10:20) Number Formatting for the PivotTable Values Area.
9. (12:47) Four examples of Column and Bar charts for Categorical Data from a Frequency Distribution PivotTable
10. (13:35) Change Default Settings in a PivotTable: PivotTable Options dialog box and Excel Options Default PivotTable Settings dialog box
11. (14:14) Why Tabular Layout is helpful
12. (16:40) #1 Rule for Visualizing Data with Charts: “No Chart Junk”.
13. (18:17) Linking Chart labels to cells with formula
14. (20:23) Copy Chart and change elements to create a slightly different visualization with a different emphasis: Add Data Labels and remove gridlines
15. (21:26)Copy Chart and create Bar chart that emphasis differences more forcefully
16. (22:17) Chart Format Task Pane and Keyboard: Ctrl + 1
17. (25:08) Type a new Chart Title
18. (26:43) Order of category labels
19. (26:55) Pareto Chart: Categorical Data Frequency Numbers Sorted in chart and add a % Cumulative Line
20. (28:58) Combo Chart: Column and Line
21. (29:54) Custom Number Formatting to show noting – this is done to hide axis numbers
22. (32:50) Video Summary
23. (33:25) Closing and Video links
Topics:
1. (00:00)
2. (00:22) Download Excel
3. (00:39) Descriptive Statistics: Tabular (Reports) and Graphical (Visualizations)
4. (01:43) What type of tabular and graphical summaries based on one variable or two variable
5. (03:00) Cheat Sheet with Terms for chapter
6. (03:16) Epic Summary for when and how to use Column and Bar Charts
7. (07:32) PivotTable to create Frequency Distribution for Categorical Variable “Payment Method”. See three calculations: Frequency, % Frequency, Relative Frequency
8. (10:20) Number Formatting for the PivotTable Values Area.
9. (12:47) Four examples of Column and Bar charts for Categorical Data from a Frequency Distribution PivotTable
10. (13:35) Change Default Settings in a PivotTable: PivotTable Options dialog box and Excel Options Default PivotTable Settings dialog box
11. (14:14) Why Tabular Layout is helpful
12. (16:40) #1 Rule for Visualizing Data with Charts: “No Chart Junk”.
13. (18:17) Linking Chart labels to cells with formula
14. (20:23) Copy Chart and change elements to create a slightly different visualization with a different emphasis: Add Data Labels and remove gridlines
15. (21:26)Copy Chart and create Bar chart that emphasis differences more forcefully
16. (22:17) Chart Format Task Pane and Keyboard: Ctrl + 1
17. (25:08) Type a new Chart Title
18. (26:43) Order of category labels
19. (26:55) Pareto Chart: Categorical Data Frequency Numbers Sorted in chart and add a % Cumulative Line
20. (28:58) Combo Chart: Column and Line
21. (29:54) Custom Number Formatting to show noting – this is done to hide axis numbers
22. (32:50) Video Summary
23. (33:25) Closing and Video links
 0:33:37
Excel Statistical Analysis 05: Frequency Distributions & Visualizations for Categorical Data
 0:28:45
Excel Statistical Analysis 06: Frequency Distributions, Visualizations & Skew for Quantitative D...
 0:04:16
Frequency Distribution table -Histogram(Exp-5)
 0:00:05
Statistics Formulas -1
 0:17:59
Excel Statistical Analysis
 0:14:59
Statistics in Excel Tutorial 1.1. Descriptive Statistics using Microsoft Excel
 0:05:36
Descriptive Statistics in Excel Using the Data Analysis Tool
 0:00:50
Find EXCEL's Hidden Month Frequency Calculator!
 0:05:52
Calculate Mean Median Mode and Standard Deviation in Excel
 0:00:10
SUM Formula in Excel | Add Total Values #shorts #excel
 0:03:21
How to Calculate P value in Excel | Perform P Value in Microsoft Excel | Hypothesis Testing
 0:28:44
Excel Statistical Analysis 24: Build Discrete Probability Distributions with Worksheet Formulas
 0:08:31
How To Perform A One-Way ANOVA Test In Excel
 0:00:23
Mean median mode range
 0:00:05
Master Data Analyst in 2024 with This Proven Roadmap
 0:08:13
Excel AI - data analysis made easy
 0:09:14
Excel Statistical Analysis 30: Introduction to Continuous Probability Distributions
 0:01:00
How to identify or highlight expired or upcoming dates in Excel? - Excel Tips and Tricks
 0:00:20
1st yr. Vs Final yr. MBBS student 🔥🤯#shorts #neet
 0:00:17
How to calculate Age in Excel? (DATEDIF function) | Calculate age from Date of Birth #shorts #excel
 0:04:18
Excel Statistics 05 - Calculating Correlations with Excel
 0:09:34
Basic Excel Business Analytics #18: Data Analysis Add-in for Frequency Distribution & Histogram
 0:07:05
Frequency distribution table using Excel data analysis toolpak
 0:18:37
Excel | Frequency Distribution | Pivot Table - Histogram - Frequency Function - Power Query
Комментарии