filmov
tv
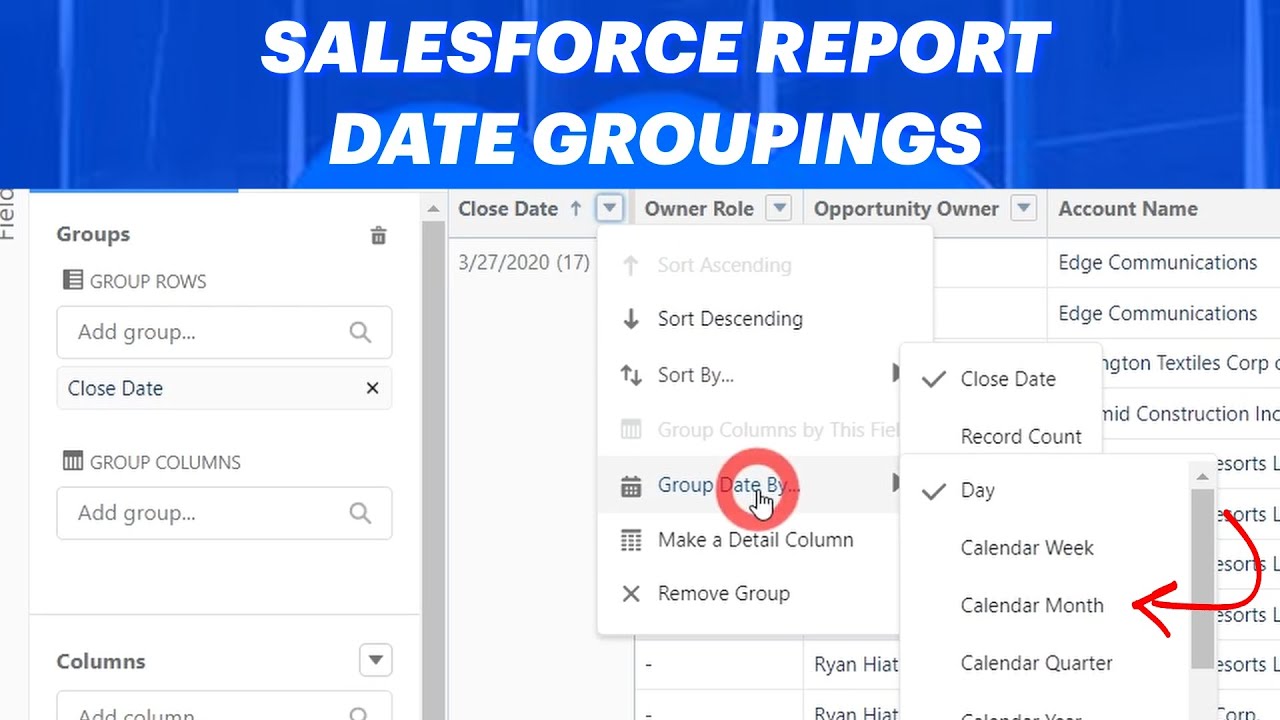
View Salesforce Data By Week, Month, Year
Показать описание
Want to see your Salesforce data in dynamic timelines? Learn how to use Salesforce report groupings to better organize your Salesforce reports.
Salesforce data groupings can split up your data by week, month, quarter, or even year! This simple knowledge of using grouped rows on a Salesforce report can transform your database into a digestible chart for anyone to understand.
Salesforce data groupings can split up your data by week, month, quarter, or even year! This simple knowledge of using grouped rows on a Salesforce report can transform your database into a digestible chart for anyone to understand.
 0:02:37
View Salesforce Data By Week, Month, Year
 0:01:57
Day, Week, Month and Resource View in Salesforce Maps Schedule | Salesforce Maps
 0:00:16
Salesforce 101: Report Filters
 0:04:16
Create a Salesforce Report in Under 5 Minutes [Easy Tutorial]
 0:06:11
10 Advanced Salesforce Reporting Features You Need to Know!
 0:05:23
How to Group Dates in Salesforce Reports | Quarterly, monthly, annually, etc...
 0:15:22
Display Salesforce Report Charts in the Record pages
 0:02:44
How to Create an Opportunities Created by Week Report in Salesforce
 0:01:00
Salesforce Spring '23 - Dynamic report filter that displays personalized results for each user
 0:08:20
22 List views in salesforce lightning experience | Salesforce Training Videos
 0:04:06
How To Use Salesforce Relative Date Filters
 0:07:53
29 List Views on standard and custom objects in salesforce classic | Salesforce Training Videos
 0:01:33
Salesforce: Find week number of the month from today() date using formula field in salesforce
 0:13:13
Dashboards in Salesforce | How to create a dashboard in Salesforce | Dashboard Basics
 0:02:34
Reporting on Stage Duration in Salesforce | Salesforce Stage Duration and Pipeline Reporting
 0:03:26
Salesforce weekly backup of data
 0:05:57
Salesforce Relative Date Filters: CAS Come and See Video
 0:00:31
How to use Salesforce List Views to Keep Your Data Clean #YouTubeShorts
 0:00:33
Excel VBA Macros: Data Entry Made Easy with These Tips and Tricks
 0:01:00
Don't Become a Data Engineer if
 0:00:31
How to Automate Data Snapshots Within Your Spreadsheet: Salesforce Example
 0:06:31
Defining Data Quality in Salesforce
 0:00:09
Scrum Master Vs Project Manager, Which One Should You Pick?🤔 | @LearnTube_ai
 0:02:31
Salesforce: Week number calculation is not correct (3 Solutions!!)
Комментарии