filmov
tv
Pre-Calculus Prep: Graphing Polar Equations r = 6sin(3x) (Radians)

Показать описание
In pre-calculus, graphing polar equations allows us to represent curves and shapes using polar coordinates. Let's explore the polar equation r = 6sin(3x) and graph it.
1. Understand the polar coordinate system: In polar coordinates, a point is represented by an ordered pair (r, θ), where r represents the distance from the origin to the point, and θ represents the angle measured counterclockwise from the positive x-axis.
2. Plotting points: To graph the polar equation, we can substitute different values of 'x' into the equation and calculate the corresponding values of 'r'. Choose a range of values for 'x' that will give you a good representation of the curve. Since 'x' represents the angle, a common range is 0 ≤ x ≤ 2π.
3. Table of values: Create a table to organize the values of 'x' and 'r' obtained from the equation.
| x | r |
|-------|-------|
| 0 | 0 |
| π/6 | 3 |
| π/3 | 6 |
| π/2 | 0 |
| 2π/3 | -6 |
| 5π/6 | -3 |
| π | 0 |
|7π/6 | 3 |
|4π/3 | 6 |
|3π/2 | 0 |
|5π/3 | -6 |
|11π/6 | -3 |
|2π | 0 |
4. Plotting the points: Using the values from the table, plot the corresponding (x, r) pairs on the polar coordinate plane. Each point represents a specific value of 'x' and 'r' on the curve. Connect the points smoothly to obtain the shape of the graph.
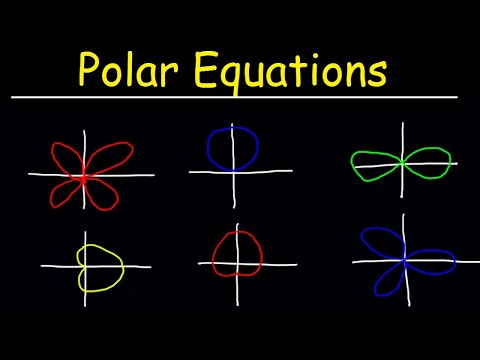
5. Shape of the graph: By connecting the plotted points, you will observe that the graph forms a curve that exhibits three complete cycles as 'x' ranges from 0 to 2π. The curve oscillates between positive and negative values of 'r' as 'x' increases.
6. Optional: You can add more points to the table and plot them to get a clearer picture of the curve and any important features. Adjusting the range of 'x' and the interval between values can help you explore the graph in more detail.
Remember to label the axes, indicate any relevant coordinates or points on the graph, and use a suitable scale for your polar coordinate plane.
By following these steps and plotting the points obtained from the polar equation r = 6sin(3x), you can graph the curve in the polar coordinate system in pre-calculus.
These videos are designed to review and reteach Precalculus and Collegeboard Pre-CALC AP content. My videos cover functions, polynomials, exponential and logarithmic expressions, trigonometry, parametric equations, polar coordinates, vectors, matrices and systems, conic sections, discrete mathematics, sequences and series; and an introduction to calculus.
Nick Perich
Norristown Area High School
Norristown Area School District
Norristown, Pa .
.
.
#math #maths #mathskills #mathsucks #mathstudent #mathsmemes #mathstudents #mathsteacher #mathsisfun #gcsemaths #quickmaths #mathstutor #mathsclass #mathstricks #mathsjokes #brunomathsson #mathstations #mathslover #mathsproblems #mathsfun #alevelmaths #earlymaths #mathsquiz #mathsmeme #mathsmock #mathsnotes #mathsbeauty #ilovemaths #lovemaths #addmaths #mathsforlife #mathsweek #mathsgames #mathsexam #eyfsmaths #mathsrevision #primarymaths #ihatemaths #mathslesson #mathstuition
 0:20:33
 0:22:19
 0:10:46
 0:04:42
 0:15:55
 0:06:35
 0:24:48
 0:01:21
 0:13:10
 0:03:26
 0:10:41
 0:05:07
 0:18:33
 0:20:57
 0:19:36
 0:00:47
 0:04:34
 0:26:12
 0:39:28
 0:15:26
 0:31:47
 0:20:32
 0:06:01
 0:15:33