filmov
tv
14. Mahalanobis distance with complete example and Python implementation

Показать описание
Mahalanobis distance with complete example and Python implementation.
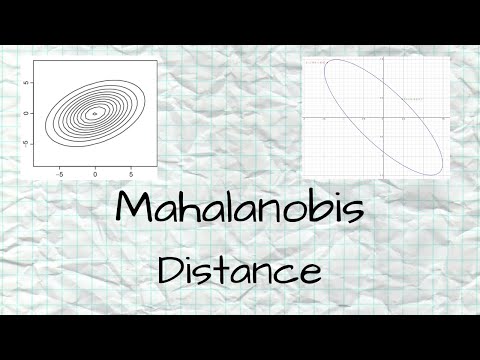
Mahalanobis distance is a distance between a data (vector) and a distribution. It is useful in multivariate anomaly detection, classification as skewed data.
Prasanta Chandra Mahalanobis was Indian scientist and statistician. He founded the Indian statistical institute.
Euclidean distance will work great as long as the features are equally important and are independent to each other.
If the variables are strongly correlated then covariance will be high. If the features of x are not correlated, then the covariance is not high and the distance is more.
 0:11:11
14. Mahalanobis distance with complete example and Python implementation
 0:04:58
What are Mahalanobis Distances
 0:11:01
Euclidean distance and the Mahalanobis distance (and the error ellipse)
 0:11:27
23: Mahalanobis distance
 0:10:56
Mahalanobis distance for classification | Machine Learning
 0:11:04
Machine Learning Blink 3.4 (probability level curves using Euclidean & Mahalanobis distances)
 0:01:54
How to calculate the Mahalanobis Distance in SPSS
 0:43:01
(IS38) Mahalanobis Distances
 0:08:19
Mahalanobis Distance| Probability Density function| Gaussian Distribution| [Estimation & Trackin...
 0:10:27
Mahalanobis Distance - intuitive understanding through graphs and tables
 0:11:17
Research Lounge: Multivariate Outlier - Mahalanobis Distance
 0:18:06
Mahalanobis Distance
 0:08:42
Mahalanobis Distances
 0:00:35
Using Mahalanobis Distance - Part 2 - Model Building and Validation
 0:09:39
MAHALANOBIS DISTANCE AND OUTLIER DETECTION (MACHINE LEARNING)
 0:00:56
#NIJPodcast Ep 06 – Decoding Mahalanobis & India's Contentious Five-Year Plans
 0:12:38
amv22 - Mahalanobis Distance
 1:00:37
Colloquium : Mahalanobis Distance and Discriminant Analysis
 0:07:56
Identifying multivariate outliers (Mahalanobis distance) in SPSS
 0:01:16
R : K-means and Mahalanobis distance
 0:09:56
Robust Unscented Kalman Filter for Target Tracking Based on Mahalanobis Distance
 0:11:40
Review Questions 3 - Mahalanobis distance and rank of covariance matrix
 0:20:07
On the use of Mahalanobis distance for out-of-distribution detection - presented at MICCAI 2023
 0:06:17
Multivariate Outlier Test Using Mahalanobis Distance
Комментарии