filmov
tv
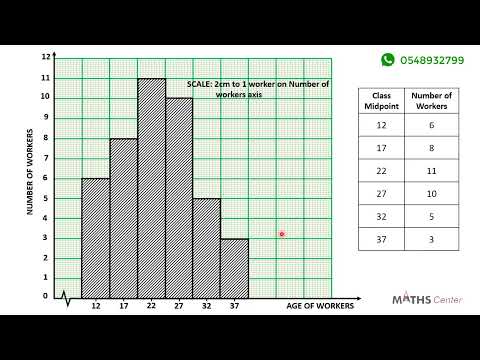
17 Drawing a Histogram for an Ungrouped Data

Показать описание
Maths Center is an Online Core Mathematics Tutorial Series
Follow Maths Center on all our Social Media Handles
Contact us on 0548932799 or 0501360621
#Maths Center
#WASSCE Questions
#Likely Examination Questions
#mathematics
#maths
#statistics
#histogram
Follow Maths Center on all our Social Media Handles
Contact us on 0548932799 or 0501360621
#Maths Center
#WASSCE Questions
#Likely Examination Questions
#mathematics
#maths
#statistics
#histogram
17 Drawing a Histogram for an Ungrouped Data
 0:03:20
How to plot Histogram in Origin | Mean | Fitting
 0:06:08
Use Excel 2016 to make Frequency distribution and Histogram for quantitative data
 0:05:02
Creating Histogram using STATA easily
 0:08:58
20 Drawing a Histogram for a Grouped Data Question 2
 0:00:34
Create a Histogram - JMP
 0:02:28
Median in a histogram | Summarizing quantitative data | AP Statistics | Khan Academy
 0:11:38
How to Make(Draw) a Histogram with Class Boundaries Example #1
 0:11:41
How to draw histogram and frequency polygon and also find the mean BCA bcs040 June 2018 solved paper
 0:02:41
Math 14 HW 2.2.17 Identify the correct histogram & does the data appear reported or measured?
 0:11:21
M17 Histograms
 0:03:48
Drawing histogram in Spreadsheet
 0:11:16
How To Make a Histogram Using a Frequency Distribution Table
 0:11:04
19 Drawing a Histogram for a Grouped Data Question 1
 0:15:41
Histogram.
 0:14:25
Histogram and Frequency Polygon
 0:03:31
Histograms Explained! | How to Make a Histogram | Math Defined with Mrs. C
 0:03:52
How to draw a Histogram in Geogebra
 0:09:22
Creating Histogram with classes in IBM SPSS 26
 0:01:34
Minitab 18: Creating a Histogram
 0:11:17
What is a Histogram? (Data Analysis & Statistics) - [6-8-29]
 0:00:23
Histogram drawing
 0:07:09
IX Statistics Draw histogram for the following table Marks 0 20 20 30 30 40 40 50 50 60 60 70 70 ab
 0:00:44
how to draw histogram
Комментарии