filmov
tv
How to Debug HardFaults on ARM Cortex-M MCUs

Показать описание
About the recorded webinar:
No matter your use case or how sophisticated your hardware is, faults happen on embedded devices all the time for a variety of reasons. Maybe it’s something easy like a reproducible NULL pointer dereference you hit during development or maybe it’s something more subtle like memory corruption or divide by zero faults that only exhibits themselves in zero-g, high temperature, weak magnetic field, or noisy RF environments!
In this recorded webinar, Chris shared his most efficient and effective tips for debugging and resolving issues quickly on ARM Cortex-M MCUs. He presents some real-world examples that he's faced over the years that will help with any MCU your device is built on.
You'll learn:
- How to recover the stack trace leading up to a fault
- MCU registers to examine when root causing a fault
- How to quickly pinpoint the source of memory - corruption bugs
- How to leverage GDB to speed up root cause analysis
- How to automate coredump collection, offloading, and processing
About the speaker:
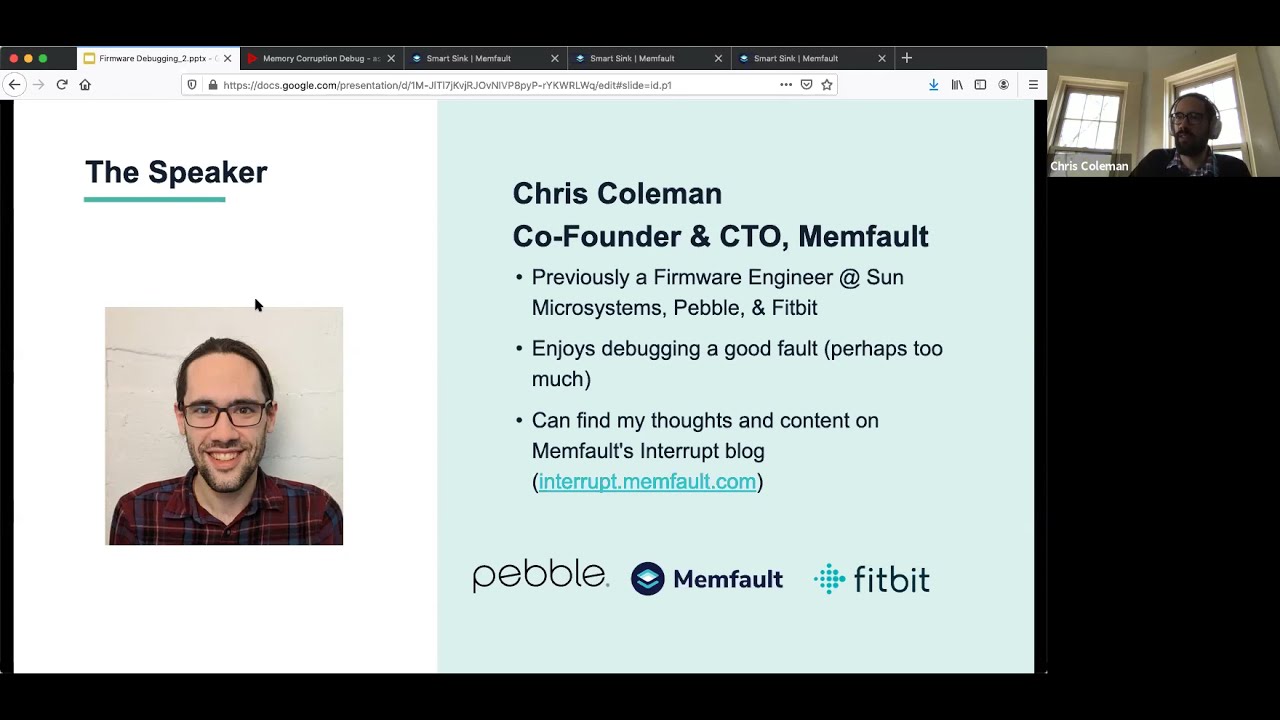
Chris Coleman is CTO and Co-Founder of Memfault. Prior to founding Memfault, Chris was an embedded software engineer at Pebble and Fitbit where he led efforts across the firmware stack and developed a reputation for tracking down and fixing challenging firmware bugs. That coupled with his passion for using tooling to efficiently deliver high-quality hardware products drove him to start Memfault. Chris graduated with a BSc in Electrical Engineering from Brown University.
0:00 - 3:45 Introduction & Agenda
3:46 - 17:58 HardFault Overview
17:59 - 19:30 Manual Debug
19:31 - 28:19 Scripting the Analysis
28:20 - 31:43 Debugging with Memfault
31:44 - 38:24 Faults at Scale
38:25 - 57:57 Q&A from live audience
Комментарии
 0:57:58
 0:22:14
 0:21:40
 0:00:15
 0:02:50
 0:07:31
 0:03:08
 0:05:23
 0:15:09
 0:03:52
 0:02:24
 0:05:20
 0:10:38
 0:36:45
 0:39:24
 0:10:51
 0:01:42
 0:29:59
 0:02:40
 0:01:17
 0:03:01
 0:05:49
 0:15:20
 0:03:31