filmov
tv
ECG analysis and interpretation | recording speed and cardiac axis

Показать описание
ECG analysis and interpretation | recording speed and cardiac axis
ECG analysis algorithm
ECG tape
Each small square of this graph paper is 1 mm in height and width.
A large square includes 5 small squares in height and width, respectively, it is equal in height and width to 5x5 mm.
Before analyzing the ECG, it is necessary to evaluate the parameters of its recording, without which data analysis is impossible.
These options are as follows:
recording speed
-voltage
Leads
ECG recording speed.
There are two most common ECG recording speeds: 25 mm / s and 50 mm / s
At an ECG speed of 25 mm / s:
- duration of 1 small cell - 0.04 sec
- duration of 1 large cell - 0.2 sec
At an ECG recording speed of 50 mm / s:
- duration of 1 small cell = 0.02 sec
- duration of 1 large cell = 0.1 sec
ECG voltage.
ECG voltage can be determined by two places on the tape:
-first place - this is the bottom or top of the ECG tape, depending on the model of the electrocardiograph. The figure shows the voltage of 10 mm / mV - this is the standard voltage of the ECG recording.
-the second place is a U-shaped tooth, which is located at the very beginning of the ECG recording.
ECG leads.
There are 12 main leads.
They are :
standard leads - I, II, III,
-reinforced leads from the limbs - aVR, aVL, aVF,
- chest leads - V1, V2, V3, V4, V5, V6.
I lead captures the potential difference from the right hand and left hand
II lead captures the potential difference from the right arm and left leg
III lead captures the potential difference from the left arm and left leg,
aVR - reinforced abduction from the right hand (R - from the English. Right - right)
aVL - reinforced abduction from the left hand (L - from the English. Left - left)
aVF - enhanced abduction from the left leg (F - from the English foot - foot)
- I - the front wall of the heart,
-III - the back wall of the heart,
-II - the sum of I and III leads,
-aVR- right side wall of the heart,
- aVL - left anterolateral wall of the heart,
-aVF - posterior wall of the heart
-V1 and V2 are responsible for the right heart, the right ventricle,
-V3 is responsible for the interventricular septum,
-V4 is responsible for the apex of the heart,
-V5 is responsible for the anterolateral wall of the left ventricle,
-V6 is responsible for the lateral wall of the left ventricle
ECG analysis sequence.
After determining the parameters of the ECG recording, a direct interpretation (analysis) of the electrocardiogram follows in the following order:
1. Rhythm assessment (regularity and pacemaker),
2. Heart rate (heart rate),
3. EOS (electrical axis of the heart),
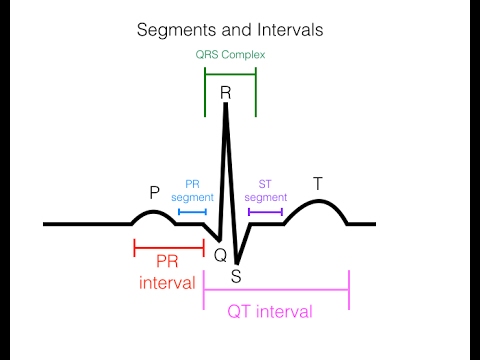
4. Analysis of the P wave,
5. Analysis of the QRS complex,
6. Analysis of the ST segment,
7. Analysis of the T wave,
8. Analysis of intervals PQ and QT,
9. Analysis of the remaining intervals and segments.
Sinus rhythm criteria:
1) P wave of sinus origin:
- required + in II, - in aVR
- usually + in I, aVF
-in V1 and V2 or + or +/-
- usually + in V3, V4, V5, V6
2) P wave in front of the QRS complex
3) the permanent shape of the P wave
Heart rate (HR).
Heart rate (HR) is equal to:
Heart rate = 60 / (R-R x t)
where:
-60 is 60 seconds in 1 minute;
-R-R is the distance in mm between two adjacent R teeth,
-t - duration of a small cell of the ECG tape:
at a speed of 25 mm / s, t = 0.04
at a speed of 50 mm / s, t = 0.02
The heart rate is 60-90 per minute
The electrical axis of the heart.
The electrical axis of the heart
is the total vector of electromotive force
The electrical axis of the heart can be represented as a vector coming from the center of the circle at a certain angle, called the angle alpha (a)
If the angle of the EOS vector a falls in the range from +30 to +69, then this is the normal electrical axis of the heart
If the angle of the EOS vector a falls in the range from +0 to +30, then this is the horizontal electric axis of the heart.
If the angle of the EOS vector a falls in the range from +0 to -90, then this is the deviation of the electrical axis of the heart to the left.
If the angle of the EOS vector a falls in the range from +70 to +90, then this is the vertical electric axis of the heart.
If the angle of the EOS vector a falls in the range from +91 to +180, then this is the deviation of the electrical axis of the heart to the right.
-Normal EOS (and from +30 to +69)
- Horizontal EOS (and from 0 to +30)
- Deviation of EOS to the left (and from 0 to -90)
- Vertical EOS (and from +70 to +90)
- Deviation of EOS to the right (and from +91 to +180)
ECG analysis algorithm
ECG tape
Each small square of this graph paper is 1 mm in height and width.
A large square includes 5 small squares in height and width, respectively, it is equal in height and width to 5x5 mm.
Before analyzing the ECG, it is necessary to evaluate the parameters of its recording, without which data analysis is impossible.
These options are as follows:
recording speed
-voltage
Leads
ECG recording speed.
There are two most common ECG recording speeds: 25 mm / s and 50 mm / s
At an ECG speed of 25 mm / s:
- duration of 1 small cell - 0.04 sec
- duration of 1 large cell - 0.2 sec
At an ECG recording speed of 50 mm / s:
- duration of 1 small cell = 0.02 sec
- duration of 1 large cell = 0.1 sec
ECG voltage.
ECG voltage can be determined by two places on the tape:
-first place - this is the bottom or top of the ECG tape, depending on the model of the electrocardiograph. The figure shows the voltage of 10 mm / mV - this is the standard voltage of the ECG recording.
-the second place is a U-shaped tooth, which is located at the very beginning of the ECG recording.
ECG leads.
There are 12 main leads.
They are :
standard leads - I, II, III,
-reinforced leads from the limbs - aVR, aVL, aVF,
- chest leads - V1, V2, V3, V4, V5, V6.
I lead captures the potential difference from the right hand and left hand
II lead captures the potential difference from the right arm and left leg
III lead captures the potential difference from the left arm and left leg,
aVR - reinforced abduction from the right hand (R - from the English. Right - right)
aVL - reinforced abduction from the left hand (L - from the English. Left - left)
aVF - enhanced abduction from the left leg (F - from the English foot - foot)
- I - the front wall of the heart,
-III - the back wall of the heart,
-II - the sum of I and III leads,
-aVR- right side wall of the heart,
- aVL - left anterolateral wall of the heart,
-aVF - posterior wall of the heart
-V1 and V2 are responsible for the right heart, the right ventricle,
-V3 is responsible for the interventricular septum,
-V4 is responsible for the apex of the heart,
-V5 is responsible for the anterolateral wall of the left ventricle,
-V6 is responsible for the lateral wall of the left ventricle
ECG analysis sequence.
After determining the parameters of the ECG recording, a direct interpretation (analysis) of the electrocardiogram follows in the following order:
1. Rhythm assessment (regularity and pacemaker),
2. Heart rate (heart rate),
3. EOS (electrical axis of the heart),
4. Analysis of the P wave,
5. Analysis of the QRS complex,
6. Analysis of the ST segment,
7. Analysis of the T wave,
8. Analysis of intervals PQ and QT,
9. Analysis of the remaining intervals and segments.
Sinus rhythm criteria:
1) P wave of sinus origin:
- required + in II, - in aVR
- usually + in I, aVF
-in V1 and V2 or + or +/-
- usually + in V3, V4, V5, V6
2) P wave in front of the QRS complex
3) the permanent shape of the P wave
Heart rate (HR).
Heart rate (HR) is equal to:
Heart rate = 60 / (R-R x t)
where:
-60 is 60 seconds in 1 minute;
-R-R is the distance in mm between two adjacent R teeth,
-t - duration of a small cell of the ECG tape:
at a speed of 25 mm / s, t = 0.04
at a speed of 50 mm / s, t = 0.02
The heart rate is 60-90 per minute
The electrical axis of the heart.
The electrical axis of the heart
is the total vector of electromotive force
The electrical axis of the heart can be represented as a vector coming from the center of the circle at a certain angle, called the angle alpha (a)
If the angle of the EOS vector a falls in the range from +30 to +69, then this is the normal electrical axis of the heart
If the angle of the EOS vector a falls in the range from +0 to +30, then this is the horizontal electric axis of the heart.
If the angle of the EOS vector a falls in the range from +0 to -90, then this is the deviation of the electrical axis of the heart to the left.
If the angle of the EOS vector a falls in the range from +70 to +90, then this is the vertical electric axis of the heart.
If the angle of the EOS vector a falls in the range from +91 to +180, then this is the deviation of the electrical axis of the heart to the right.
-Normal EOS (and from +30 to +69)
- Horizontal EOS (and from 0 to +30)
- Deviation of EOS to the left (and from 0 to -90)
- Vertical EOS (and from +70 to +90)
- Deviation of EOS to the right (and from +91 to +180)
 0:06:56
EKG like a BOSS Part 1 - How to Read EKGs (ECG interpretation for nurses)
 0:36:08
ECG Interpretation | Clinical Medicine
 0:12:14
Most Common ECG Patterns You Should Know
 0:20:44
How to Read an ECG | ECG Interpretation | EKG | OSCE Guide | UKMLA | CPSA
 0:16:33
Rapid, structured ECG interpretation: A visual guide FOR REVISION!! #electrocardiogram
 0:59:14
MASTER ECG/EKG INTERPRETATION: A Systematic Approach for 12 Lead ECG/EKGs | Retired
 0:20:56
Intro to EKG Interpretation - A Systematic Approach
 0:22:50
EKG/ECG Interpretation Basics Nursing NCLEX | QRS Complex, P Wave, T Wave, PR Interval
 1:19:14
EKG Basics | How to Read & Interpret EKGs: Updated Lecture
 0:04:13
ECG Waveform Explained and Labeled | ECG Interpretation Nursing NCLEX
 0:08:36
Electrocardiography (ECG/EKG) - basics
 0:10:26
Analysis of Heart Rhythm, Heart Rate, P wave, PR interval, QRS Complex - EKG | @LevelUpRN
 0:03:06
5 minute EKG/ECG Interpretation for NCLEX-RN - Simplenursing
 0:18:33
How to interpret an ECG systematically | EXPLAINED CLEARLY!
 0:34:38
Interpreting the ECG | The Advanced EM Boot Camp
 0:09:28
Heart Conduction & ECG (EKG) Interpretation
 0:03:09
EKG Rhythms | 5-Step Interpretation | Easy How To
 0:12:24
EKG/ECG Interpretation (Basic) : Easy and Simple!
 3:00:35
EKG Interpretation | Master Fundamentals of ECG | Electrocardiography
 1:25:12
ECG Analysis & Interpretation
 0:14:35
ECG Interpretation Made Easy - How to Read a 12 Lead EKG Systematically!
 0:26:57
ECG Interpretation Made Easy; How to read 12 Lead EKG (Basics), USMLE/NCLEX
 0:48:44
EKG Rhythms | ECG Heart Rhythms Explained - Comprehensive NCLEX Review
 0:18:51
Basic Arrhythmias | Sinus, Brady, Tachy, Premature Beats | ECG EKG Interpretation (Part 3)
Комментарии