filmov
tv
RIGHT ENDPOINT RULE | Estimate the area under the graph f(x)=1/x from x=1 to x=2 four rectangles
Показать описание
Estimate the area under the graph of f(x)=1/x from x=1 to x=2 using four approximating rectangles and right endpoints. In this video I'll show you how to estimate the area under the graph using four approximating rectangles and right endpoints. Of course, this same technique can be applied for any number of estimating rectangles. And the process for left endpoints and midpoints is similar too. I'll show you how to estimate the area under this curve with the right endpoint formula, also known as the right endpoint Riemann sum equation.
RECOMMENDED READING
0:00 Intro - Estimate the area under the graph
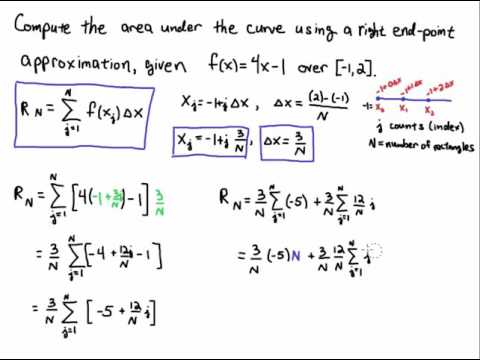
0:25 Right endpoint Riemann sum equation
1:59 Determine pieces of the right endpoint formula
3:37 Plug i values into the right endpoint formula sum
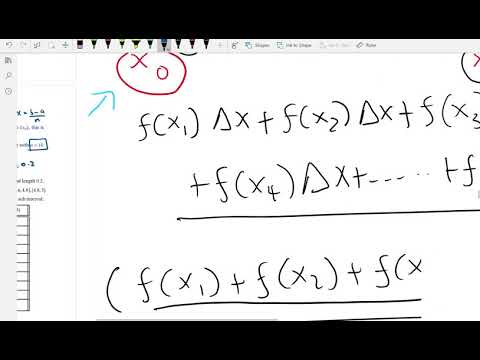
7:06 Add up all terms representing rectangle areas
WATCH NEXT
YOU MIGHT ALSO BE INTERESTED IN...
Some links in this video description may be affiliate links meaning I would get a small commission for your purchase at no additional cost to you.
RECOMMENDED READING
0:00 Intro - Estimate the area under the graph
0:25 Right endpoint Riemann sum equation
1:59 Determine pieces of the right endpoint formula
3:37 Plug i values into the right endpoint formula sum
7:06 Add up all terms representing rectangle areas
WATCH NEXT
YOU MIGHT ALSO BE INTERESTED IN...
Some links in this video description may be affiliate links meaning I would get a small commission for your purchase at no additional cost to you.
 0:20:10
Riemann Sums - Left Endpoints and Right Endpoints
 0:07:47
RIGHT ENDPOINT RULE | Estimate the area under the graph f(x)=1/x from x=1 to x=2 four rectangles
 0:06:42
Estimate the area under 1/x with left endpoint and right endpoint approximation
 0:15:41
Riemann sums with right endpoints
 0:03:43
Area estimate right endpoints
 0:05:41
Approximating Area Under A Curve Using Rectangles and Right Endpoints
 0:08:31
Right endpoint estimate of area under a linear function.
 0:16:57
Left and right endpoint approximations
 0:14:04
Estimating Area using Rectangles | Left Endpoints Rule, Right Endpoints Rule & Midpoint Rule
 0:22:05
Area Problem - Riemann Sums - Left Endpoints - Right Endpoints | Calculus
 0:11:40
Midpoint Rule & Riemann Sums
 0:05:29
Estimating Area Under the Curve using Left/Right Endpoint Reimann Sums
 0:03:19
Right hand riemann sum approximation
 0:08:49
Numerical Integration 2: Right Endpoint and Midpoint Approximations
 0:07:23
Riemann Sum: Left Endpoint & Right Endpoint Rectangles
 0:08:32
Left, Right, & Midpoint Riemann Sum Formulas
 0:07:44
Approximate Integration-Right end point rule-Lesson-6
 0:13:02
Left and right endpoint approximations (edited)
 0:20:21
Riemann Sums - Left Endpoints - Right Endpoints | Estimate area Under y = sin x | Calculus
 0:07:01
Estimating area under a curve using right-hand end points
 2:07:03
Calculus 1 Lecture 4.3: Area Under a Curve, Limit Approach, Riemann Sums
 0:53:36
5.1.1 Estimate Area Under Curve (Left Endpoint, Right Endpoint, Midpoint Approximation)
 0:09:23
Calculus I: Approximating area under the curve using rectangles
 0:06:39
LEFT ENDPOINT RULE | Estimate the area under the graph f(x)=1/x from x=1 to x=2 four rectangles
Комментарии