filmov
tv
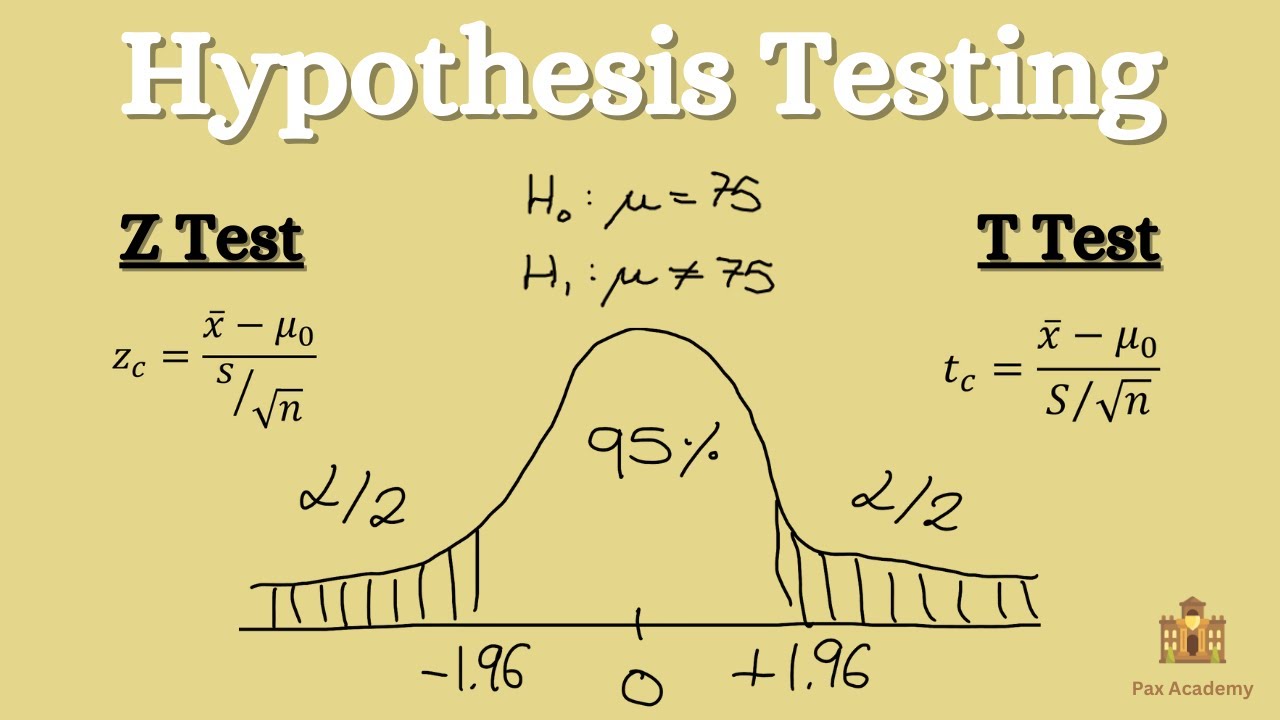
Hypothesis Testing - Z test & T test
Показать описание
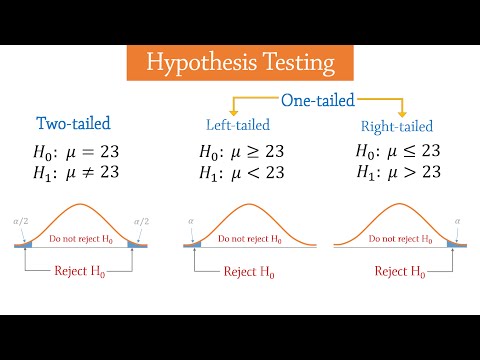
In this video we solve some hypothesis testing problems using both the z test and t test. It involves one-tail and two-tail tests.
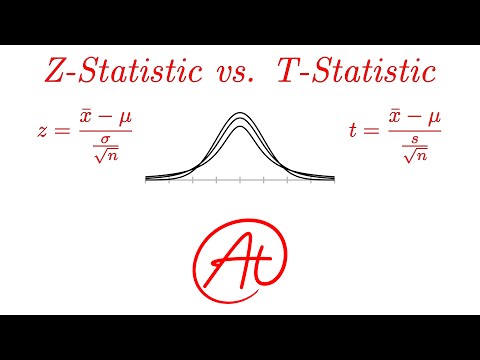
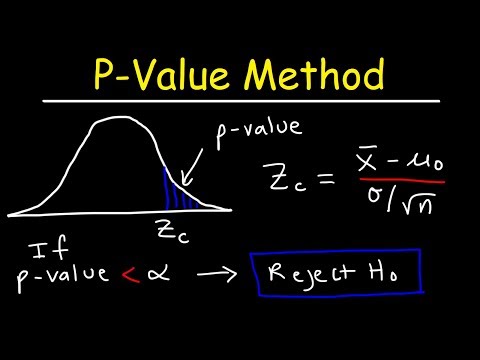
We look at when to use the z test and when to use the t test. We then apply our learning to some exercises. They involve stating the null and alternative hypothesis, calculating the critical value, calculating the z/t value and finally determining whether we reject or accept the null hypothesis.
0:00 When to use which test
01:00 Exercise 1
04:52 Exercise 1 - Critical Value
06:20 Rest of Exercise 1
08:36 Exercise 2
11:25 Exercise 2 - Critical Value
12:50 Rest of Exercise 2
 0:13:34
Hypothesis Testing Problems - Z Test & T Statistics - One & Two Tailed Tests 2
 0:05:55
Hypothesis Testing: Two-tailed z test for mean
 0:14:14
Hypothesis Testing - Z test & T test
 0:04:00
Hypothesis Testing - Introduction
 0:06:17
One Sample z-Test
 0:04:31
Z- test
 0:06:39
Z-statistics vs. T-statistics | Inferential statistics | Probability and Statistics | Khan Academy
 0:04:08
Z-Statistics vs. T-Statistics EXPLAINED in 4 Minutes
 0:15:49
Hypothesis Testing - Solving Problems With Proportions
 1:08:17
Hypothesis testing (ALL YOU NEED TO KNOW!)
 0:11:13
Z Tests for One Mean: Introduction
 0:25:36
Tutorial 17-Hypothesis Testing And Statistical Analysis Using Z test
 0:17:48
P-Value Method For Hypothesis Testing
 0:04:11
One Sample Z-Test Example
 0:06:58
Hypothesis tests on one mean: t test or z test?
 0:19:54
How To Know Which Statistical Test To Use For Hypothesis Testing
 0:11:26
Lec-39: Introduction to Z-Test | Probability and Statistics
 0:22:45
Hypothesis Testing Problems - Z Test & T Statistics - One & Two Tailed Tests 2 || problem 1
 0:06:57
How to do Z Test in Excel | Z-Test Example | Statistical Test
 0:09:53
Mastering Hypothesis Testing for Data Science Interviews: Binomial, Z-test, and T-test
 0:37:25
HYPOTHESIS TESTING | ONE SAMPLE Z TEST | Statistics | Tagalog Explained
 0:14:08
z-Score, z-Standardization, Standard Normal Distribution, z-Distribution Table - Simply explained
 0:13:56
What is Hypothesis Testing ? Math, Statistics for data science, machine learning
 0:07:26
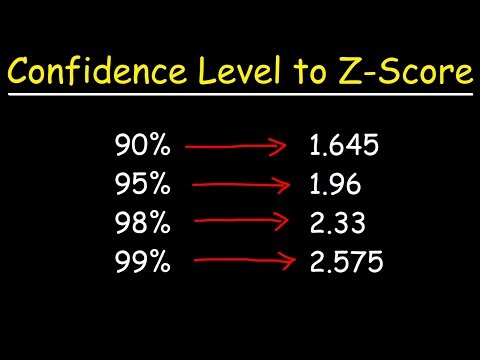
How To Find The Z Score Given The Confidence Level of a Normal Distribution 2
Комментарии