filmov
tv
Categorical Variables

Показать описание
Categorical variables like Religion, Gender and Ethnicity tell us about group membership. We show you how to use bar charts and tables to display such data informatively and interpret it.
After you’ve watched this video, you should be able to answer these questions
•What is the basic graph that we use for displaying the data for a categorical variable?
•Why do we use this in preference to pie charts and segmented bar charts?
•What features of the data does a bar chart highlight? (What sorts of things can we easily see?)
 0:02:37
Categorical Versus Quantitative Variables
 0:02:39
Types of Data: Categorical(Nominal, Ordinal), Numerical(Discrete, Continues) Stats: part-1
 0:04:59
Categorical Variables
 0:04:12
💯 The Categorical Variables in Statistics Explained with Fair Examples
 0:02:40
Identifying individuals, variables and categorical variables in a data set | Khan Academy
 0:07:09
Regression with categorical independent variables
 0:05:06
Python Tutorial: Dealing with categorical features
 0:10:55
Nominal, Ordinal, Interval & Ratio Data: Simple Explanation With Examples
 0:07:06
The Area Principle (How to Make Good Charts) | Statistics
 0:08:56
Variable Encodings for Machine Learning | Categorical, One-Hot, Dummy, Ordinal | ML Fundamentals 4
 0:11:44
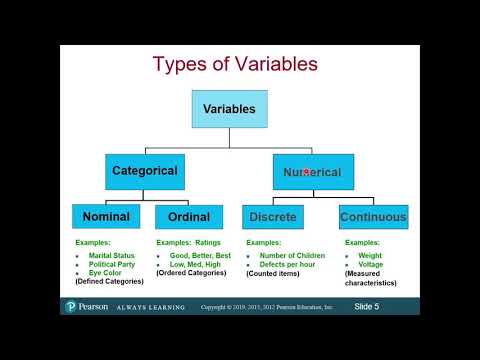
Types of Variables - Numerical vs. Categorical - Discrete vs. Continuous - Ordinal vs. Nominal
 0:11:51
Classification of Variables and Types of Measurement Scales
 0:07:56
Categorical Variables in Stata
 0:03:36
Types of Variables: Discrete, Continuous & Categorical
 0:23:19
Advanced Regression - Categorical X variables and Interaction terms
 0:06:47
Continuous vs Categorical Variables
 0:11:32
Featuring Engineering- Handle Categorical Features Many Categories(Count/Frequency Encoding)
 0:05:47
Association of Categorical Variables | Cramer's V
 0:02:36
Data management: How to label the values of categorical variables
 0:04:00
Comparing Categorical variables using SPSS
 0:08:44
Categorical Predictor/Dummy Variables in Regression Model in SPSS
 0:02:48
Data management: How to create a categorical variable from a continuous variable
 0:06:05
What are categorical data or categorical feature or categorical variable in machine learning
 0:07:00
Association and Categorical Variables
Комментарии