filmov
tv
How to Graph the Linear Equation x + 2y = 3

Показать описание
In this video we'll draw the graph for x + 2y = 3.
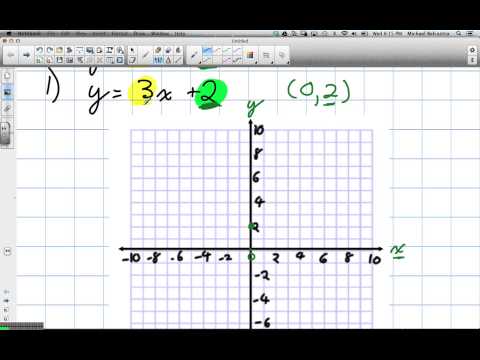
If we rearrange the equation x + 2y = 3 we can also use the slope intercept formula to draw the graph.
The general format y=mx + b (sometimes written y=mx + c).
b tells us where the graph crosses the y axis. That gives us our first point for the graph.
We can use the slope to find the rise over run. The slope, m, is -1/2 So we go DOWN 1 on the y axis and over 1 on the x axis. We can do that as many times as we need to in order to draw an accurate line.
I prefer to use the slope intercept form since it is much quicker with some practice. Then I’ll plug some values into x + 2y = 3 to make sure they fall on the line. If they don’t there is likely a problem.
When graphing equations it is helpful to have them in slope intercept form (y = mx + b), just like we have in this video.
 0:05:57
Drawing Linear Graphs
 0:04:53
Graphing a linear equation by rewriting from standard form to slope intercept form
 0:13:10
Graphs of linear equations | Linear equations and functions | 8th grade | Khan Academy
 0:03:46
How to Graph Lines in Slope Intercept Form (y=mx+b)
 0:07:05
How To Graph Linear Inequalities In Two Variables - Basic Introduction, Algebra
 0:05:15
Solving Systems of Equations By Graphing
 0:00:46
How to draw graph of the Linear Equation y=2x+3 #math #tutor #mathtrick #learning #shorts #graph
 0:32:05
Linear Equations - Algebra
 0:05:33
Learn to graph a line in slope intercept form
 0:13:24
Basic Linear Functions - Math Antics
 0:10:14
Algebra Basics: Graphing On The Coordinate Plane - Math Antics
 0:05:07
Learn how to graph a linear inequality
 0:10:05
How To Find The Equation of a Line From a Graph | Algebra
 0:06:56
Learn how to graph and shade a system of linear inequalities in two different ways
 0:12:00
Understand How to Graph Lines in 10 min (y=mx + b)
 0:04:53
GCSE Maths - What on Earth is y = mx + c #67
 0:10:45
How To Graph Linear Equations In Slope Intercept Form and Standard Form - Algebra
 0:03:58
How To Graph Linear Equations In Point Slope Form | Algebra
 0:03:33
Ex 1: Graph a Linear Equation Using a Table of Values
 0:04:31
Learn to graph a linear equation when it is in slope intercept form
 0:04:55
How to graph a linear equation using MS excel
 0:03:15
Graph a linear equation by the x and y intercepts
 0:08:56
How to Graph Linear Relations Grade 9 Academic
 0:06:56
Graphing in Algebra: Ordered Pairs and the Coordinate Plane
Комментарии