filmov
tv
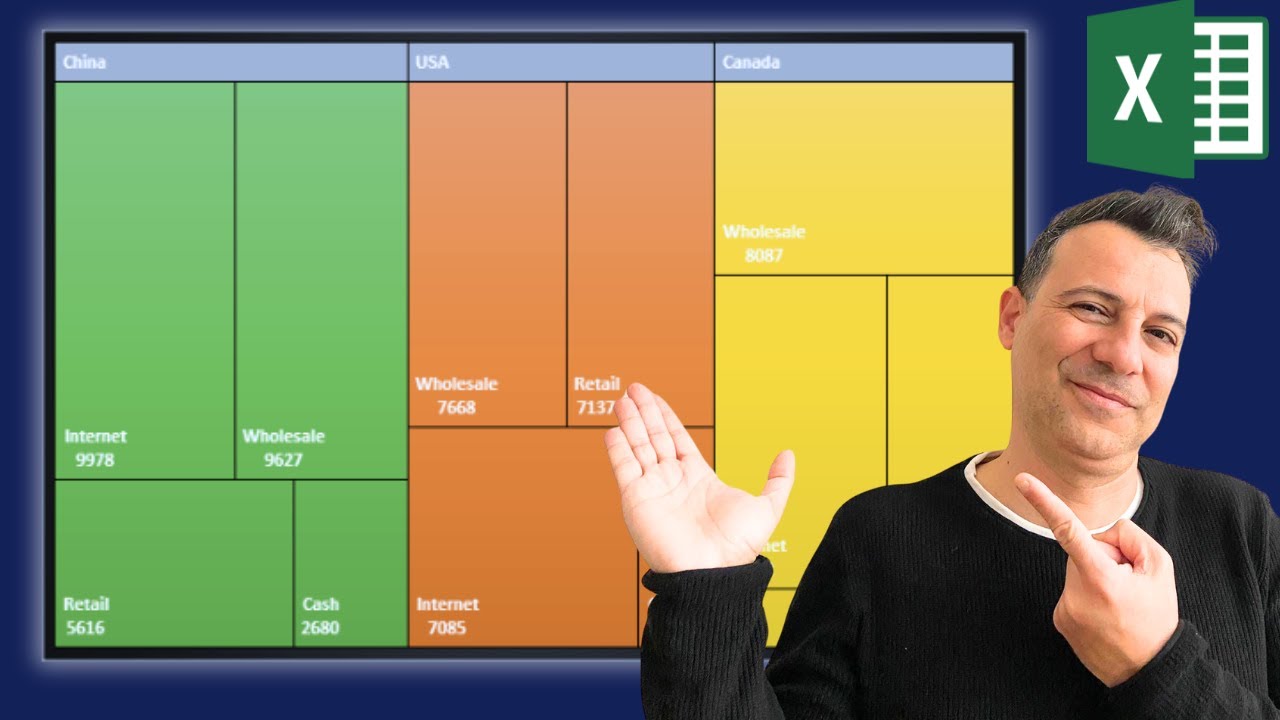
Creating a TREE MAP Chart in Excel 2019 Made EASY!🌲🌳
Показать описание
In this video tutorial I'll show you how to create and modify a TreeMap Chart in Excel 2019. Excel 2016's new Tree map Graph offers an interesting way to visualize a hierarchy of data.
A treemap chart is a type of data visualization that is especially useful for displaying hierarchical data. On a treemap, each item is represented by a rectangular shape, where smaller rectangles represent the sub-groups. The color and size of rectangles are typically correlated with the tree structure, which in return makes it easier to see the groups and sizes. Treemap charts are great for highlighting the contribution of each item to the whole, within the hierarchy. In this lesson I’ll show you how to create and modify a treemap.
───────────────────────────────────
💎Check Out My Online Courses ►►►►►►►►►►►►►►►
Create Excel Dashboards, Interactive Excel Graphs and Pivot Charts with Microsoft Excel 2019 + Free Excel Templates
Become a proficient Excel Macro Programmer in a very short time + Excel VBA for beginners. Excel Templates included.
Learn Excel Power Pivot - Power Map and Excel Power BI Tools. Build Excel Data Analyst Models with Microsoft Excel 2019
The Best 100 Excel Tips & Hacks with Microsoft Excel 2016 - Excel Templates Included
Learn from scratch professional Advanced Excel Charts with Microsoft Excel 2019 - Excel Templates included
A Python Practical Programming Course for Absolute Beginners - Learn how to Code in Python and Improve your Productivity
Boost your Productivity with 25+ Gmail Techniques like Gmail Filters , Security , IFTTT . Master Email Communication
─────────────────────────────────────────────────────
#HowToCreateChartinExcel #ExcelChart #Howto
 0:03:58
 0:09:09
 0:02:10
 0:04:57
 0:06:35
 0:04:39
 0:00:29
 0:07:51
 0:38:35
 0:01:16
 0:06:09
 0:06:54
 0:01:39
 0:00:49
 0:03:19
 0:05:50
 0:02:24
 0:02:42
 0:08:45
 0:03:33
 0:03:28
 0:02:13
 0:08:09
 0:05:15