filmov
tv
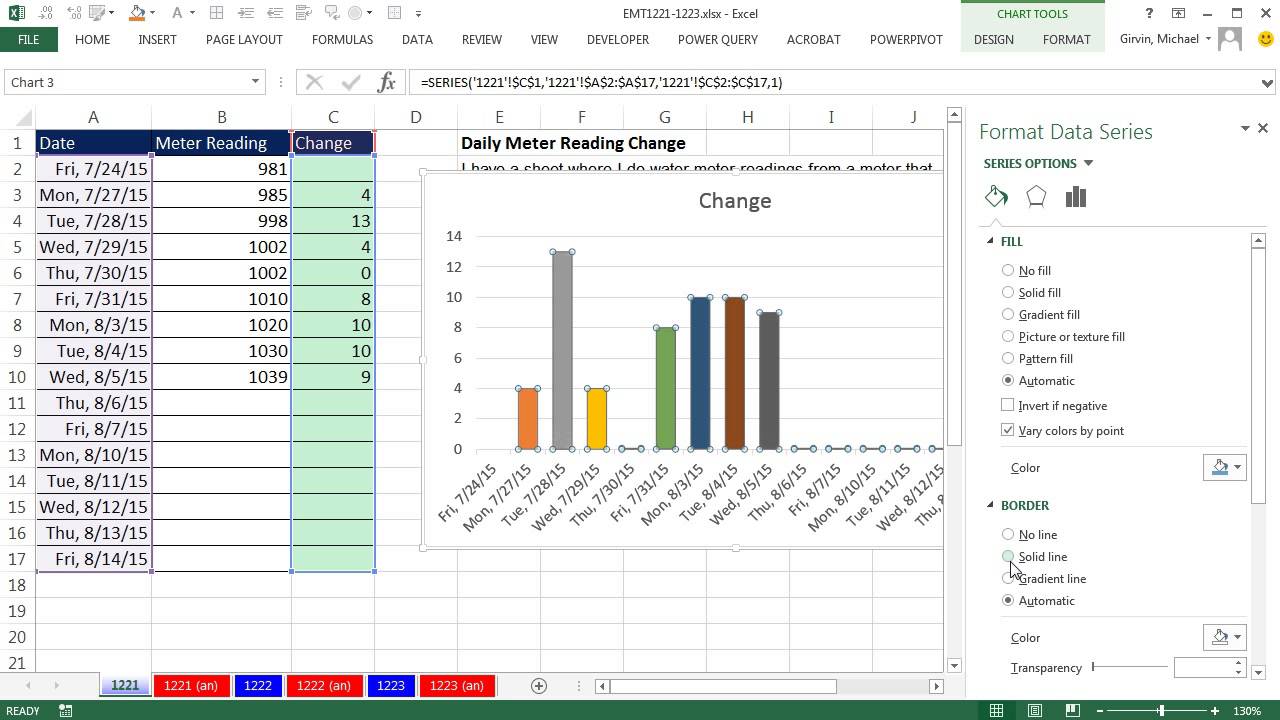
Excel Magic Trick 1221: Dynamic Chart to Plot Daily Changes in Meter Readings
Показать описание
Learn how to create a dynamic chart that updates when daily meter readings are entered into a table
1. (00:10) Problem Setup
2. (00:50) IF function and ISNUMBER Function to remove huge minus number from chart
3. (05:34) Excel Table feature to create dynamic Chart. Automatically Add New Daily Records To Chart.
 0:08:57
Excel Magic Trick 1221: Dynamic Chart to Plot Daily Changes in Meter Readings
 0:05:38
Excel Magic Trick 1233: VLOOKUP to 36 Different Dynamic Tables: Table Feature & INDIRECT Functio...
 0:04:06
Excel Magic Trick 1228: Hours Worked Formula For Date & Time Values & Time Custom Number For...
 0:05:44
Excel Magic Trick 1223: Power Query UnPivot Feature to Create Proper Data Set For Sales & Grade ...
 0:04:17
Excel Magic Trick 1219: Paste Special Linked Picture so PivotTable is not Hidden When Filter Applied
 0:08:46
Excel Magic Trick 1234: VLOOKUP to 36 Different Tables: Helper Column w LOOKUP & Expandable Rang...
 0:09:01
Excel Magic Trick 1218: PivotTable & Slicer To Show Historical Adj Stock Price by Year & Mon...
 0:08:57
Excel Magic Trick 1224: Which Similar Array Formula? Compare Number of Array Operations
 0:02:37
Excel Magic Trick 1229 Extract Items NOT in List 1: Conditional Format Unique Values & Sort by C...
 0:01:51
Excel Magic Trick 1241: Keyboard To Copy Formula Next To Data Set Down A Column
 0:04:07
Excel Magic Trick 1214: How To Enter Text Criteria Into Excel Database Functions
 0:10:02
MS Excel magic trick | Part 2 | How to make PowerPoint Presentation Dynamic with MS Excel
 0:08:42
Excel Magic Trick 1232: VLOOKUP to 36 Different Tables: Power Query Transforms 36 Tables Into 1
 0:07:14
Excel Magic Trick 1236: Count Numbers that Contain Whole Number 4: COUNTIFS or SUMPRODUCT?
![[Free Excel Tutorial]](https://i.ytimg.com/vi/RNQ0jLubDVg/hqdefault.jpg) 0:06:40
0:06:40
[Free Excel Tutorial] HOW TO DYNAMICALLY CHANGE EXCEL CHART DATA - Full HD
 0:08:10
Excel: Dynamic graphic displaying the selected item graph
 0:02:21
Excel Magic Trick 1240: Double Click To Copy Formula Down When Formula Is Not Next To Data Set
 0:04:00
How to Get Sum of Orders in One Quarter Shipped in the Next Quarter in Excel. [HD]
 0:05:36
Column Chart With Dynamic Chart Title
 0:12:39
Excel Magic: Spinning Chart - VBA
 0:35:56
Excel Magic Trick 1451: Hack Data Model, Date Table & DAX Measures WITHOUT buying Power Pivot
 0:00:41
DSCN1221 rigel
 0:02:41
How to do a VLOOKUP #12 : Create a Dynamic Chart using VLOOKUP
 0:04:44
Excel Magic Trick 1191: VLOOKUP: Lookup Temperature and Return to Bat Observation Table
Комментарии