filmov
tv
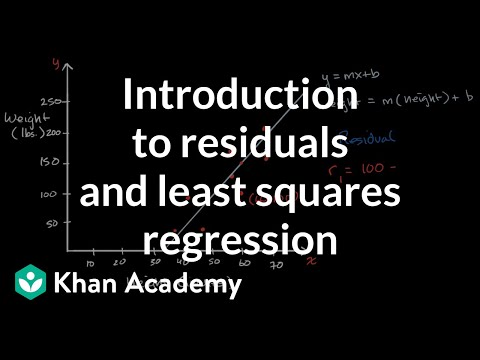
Regression Theory 03: Visualizing Residuals and Linear Regression

Показать описание
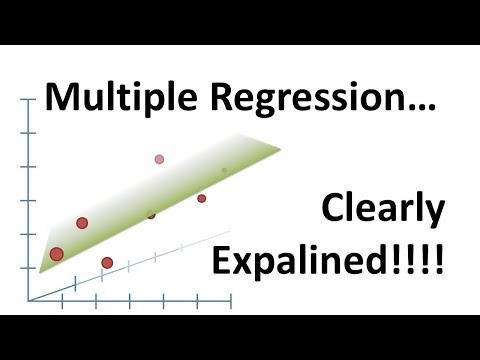
Here, I show how we can visualize a linear regression equation. Ultimately, linear regression is choosing the best regression coefficients (betas) to create a regression line that minimized the sum of the squared residuals - with Simple Linear Regression (one outcome variable and one independent variable), it is possible to view this on a scatter plot.
 0:27:41
 0:07:39
 0:02:34
 0:09:06
 0:09:47
 0:02:43
 0:05:25
 0:02:55
 0:05:53
 0:09:38
 0:45:17
 0:07:19
 0:46:18
 0:33:46
 0:27:27
 0:03:34
 0:04:35
 0:20:27
 0:03:36
 0:08:06
 0:18:14
 0:25:35
 0:01:47
 0:18:36